Introduction of the Transient Phenomenon pH Meter, ΔpHI
and
BioMedical Application
Tadasi P. Sato
Preface
Most of secreted fluids from the living body such as lacrima, saliva, and pancreatic juice contains bicarbonate ion and its pH level changes with time because of escape CO2 from the fluid. Therefore careful measurement is required to know an accurate pH level of the fluid. However, if we could measure a change in pH due to escape of CO2 quantitatively, we can also estimate an initial concentration of carbonic ion very quickly. Thus, an pH meter to measure the steady level of pH as well as a change in pH due to escape of CO2 has been devised as a transient phenomenon pH meter.
The fundamental data accumulating so far were recorded about the transient phenomenon pH meter, and it is published in an occasion of the lecture in the United States NIH as a pamphlet of CD-ROM base which introduces this pH meter, ΔpHI and the application examples. This pamphlet was prepared as a booklet binding related articles which were published or unpublished, and also prepared index terms to quickly jump to a necessary position.
If it is used to put on the elucidation of the various secretion phenomena in the biomedical field and also used in the clinical place by the medical stuff, it is my pleasure.
Tadasi P. Sato
Associate Professor
Department of Oral Physiology
School of Dentistry
Iwate Medical University
Morioka 020-8505, Japan
Version 1.00
July 10 '2001
Quantitative measurement of pH shift due to CO2 escape
Physicochemical characteristics of ΔpHI
A model of saliva secretion considering the role of carbonic anhydrase 16
Chapter 2: Application of the transient phenomenon pH meter in the biomedical field 20
Dysgeusia
Disappearance of the phantom sweetness symptoms and salivary parameter of ΔpHI and the Na+ concentration. 31
・Origin of the transient phenomenon pH meter
pH Variation of the Resting-Saliva during the Recording in the Uncovered Mode 52
・Nomogram to estimate [HCO3-] from pH1 and ΔpHI 58
・Escape of CO2 from a solution 59
・Influence of humidity on the ΔpHI 60
・Influence in thickness of sampling sheet on the ΔpHI 61
・Escape of CO2 with time from a sample of saliva 62
・Effect of oxygen on the ΔpHL 65
 Chapter 1
A pH curve of human resting saliva sampled with a small paper slip and its
medical application Return to Contents
Tadasi P. SATO
Department of Oral Physiology, School of Dentistry, Iwate Medical University, 1-3- 27 Chuo-dori, Morioka 020-8505, Japan
E-mail address: tpsato@iwate-med.ac.jp
Address for correspondence: Tadasi P. SATO, Department of Oral Physiology, School of Dentistry, Iwate Medical University, 1-3- 27 Chuo-dori, Morioka 020-8505, Japan
Index of jump to the following contents;:
Quantitative measurement of pH shift due to CO2 escape
Physicochemical characteristics of ΔpHI
Abstract
When measuring the pH of resting saliva collected using a small paper slip, the curve that accompanies the escape of CO2 can be recorded. The pH curves were examined to determine whether there were any differences in secretion characteristics among individuals. The following results were obtained: (1) three variables, pH1, ΔpHI, and ΔpHL, that distinguish a saliva pH curve show the secretory characteristics of each individual, (2) a characteristic about the size of the ΔpHI value of each individual was maintained over 36 months under the healthy condition.
Key words: saliva at rest, human, bicarbonate ion, health care
SINCE STARR (1922) REPORTED a shift in the pH of human mixed saliva caused by deep breathing and other conditions (1), it has been shown that NaHCO3 in the saliva accounts for the main component of buffering action (2)
and the difference in the pH titration curves with and without HCO3- (3). Later, Ericsson carried out a clinical study of the buffering action of human saliva (4). A method for measuring the saliva was then developed (5-6), and the buffering effect was studied further (7-9). However, there had been little research on pH displacement of saliva accompanying the escape of CO2 until the study by the author of previous short report (10).
The author improved the pH meter developed by invention of Kotani and Tomita (11-12) for application to medical and dental fields which frequently handle samples containing HCO3- (13), and performed a basic research to monitor one's secretory function of the resting saliva (14). The method of measuring pH was as follows: the steady pH value of saliva sampled using a small paper slip was first recorded under blocking escape of CO2 from the surface of the sample by a plastic plate, and then change in pH with time caused by CO2 escape was recorded after removal of the plastic plate. The value of the pH change which was studied for the saliva (15-18) and the tear fluid (19-21) might provide that it is a useful index as the clinical inspection.
In this paper, details of the pH curve and the characteristic variables due to escape of CO2 from saliva, individual differences in the pH curve, and the statistical distribution of these parameters are reported. The physiological meanings of the characteristic variables are also discussed.
Materials and Methods
One hundred μl of mixed saliva was collected from between the dorsal tongue and the palates of each subject during rest using two paper slips (15 x 10 mm2、YO-11、HORIBA). The resting saliva (hereafter called simply saliva) on one paper slip was used for pH measurement, and saliva on the other paper slip was used for measurement of Na+ and K+ concentrations (model C-122 & C-131, HORIBA, Jpn).
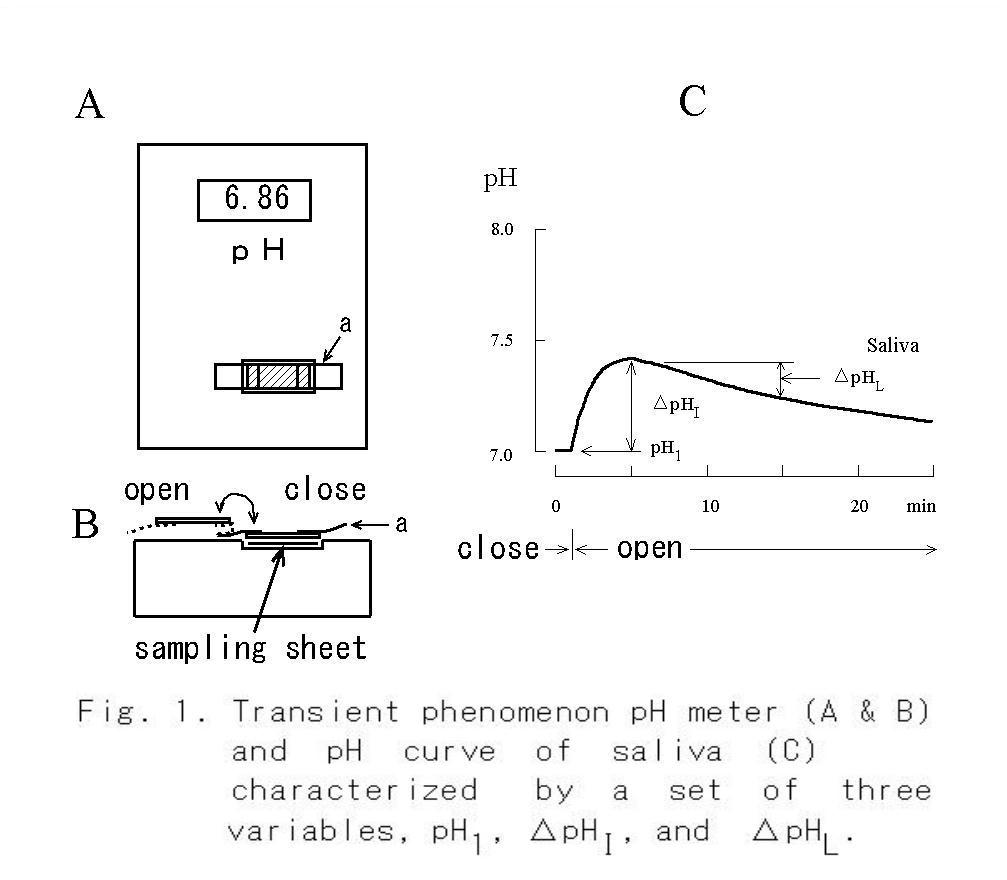
For recording of the pH curve, a pH meter equipped with a flat-type pH sensor (model C-1, Horiba, Jpn) with an adaptor with a plastic plate ('a' in Fig 1 (13)) to change the measuring mode from covered to uncovered was used. The steady pH level in the saliva (Fig. 1C, closed) was measured in the covered mode, and the change in pH with time caused by escape of CO2 was recorded after exchanging the measuring mode to the open
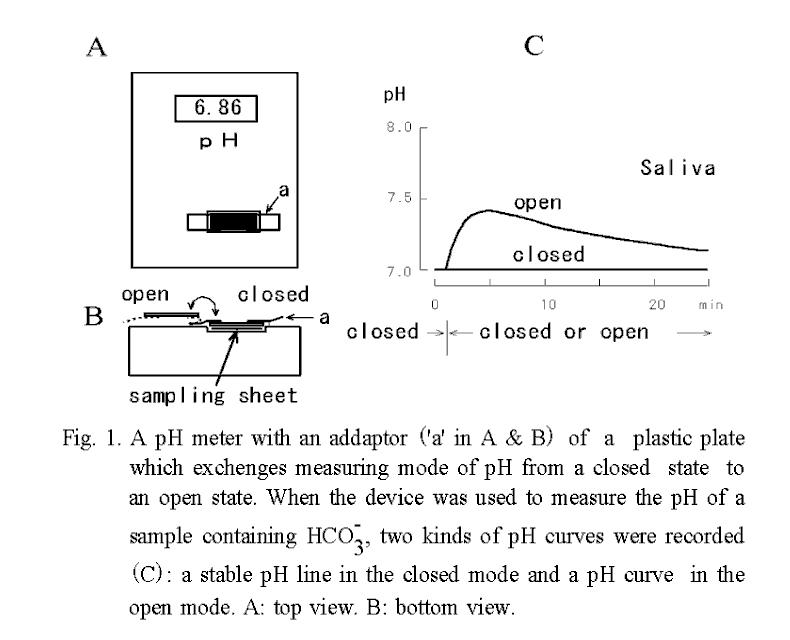
mode at 1 min (Fig. 1B, open). Blood pressure, heart rate, and oral temperature were also recorded. Besides these measurements, the time needed to collect a sample of 100 μl saliva roughly counted by a step of 0.5 min about a
part of the subjects.
In order to compare intra-individual variance with inter-individual variance by one-way ANOVA, data without any complaints obtained from 5 adults (2 females and 3 males; mean age, 59.9 ±16.5 years) over a period of 36 months were used. Measurements were performed once a month at the same clock time to minimize circadian fluctuations. The data were also collected from a large group of 663 dental students (mean age, 21.7 ± 2.4 years).
Procedure of the measurement was prepared based on the Helsinki Declaration (22) and it performed in accordance with the principle of the informed consent. A PC9821Nr15 computer (NEC, Jpn) and an Excel type spreadsheet program of ALL IN ONE (TES INTERNATIONAL, Jpn) were used to analyze the data. One-way ANOVA and Student's t-test were used for statistical analysis, and significance was judged by the two-tailed test with 5 % error probability.
Results
Saliva pH curves.
Temporal changes in pH of saliva and of a substitute solution containing 18.5 mM of 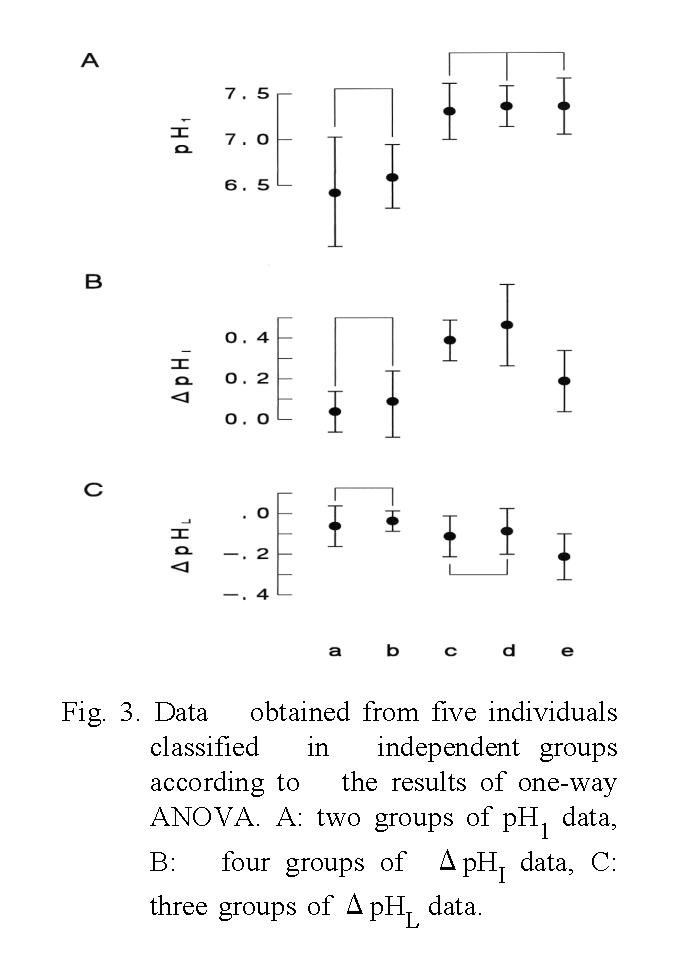
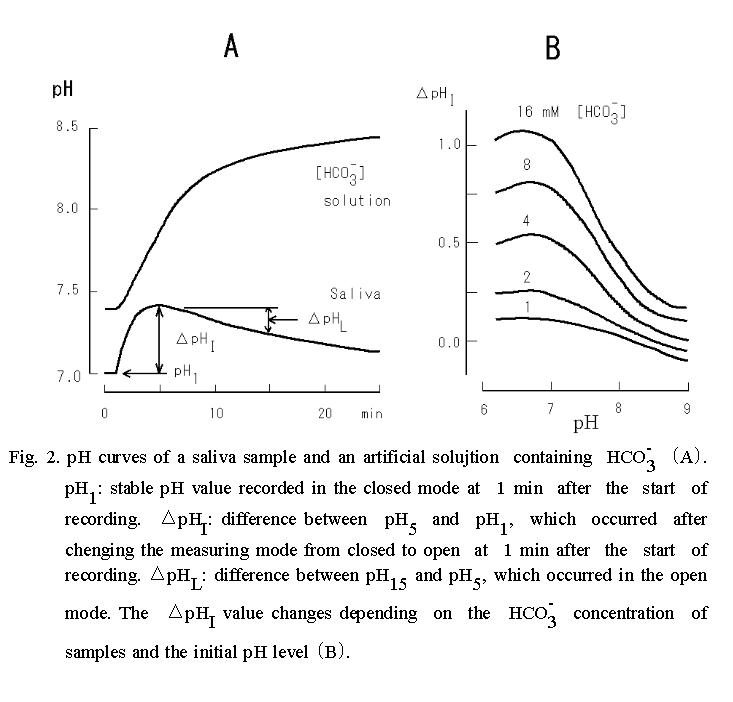
NaHCO3 are shown in Fig. 2 A. The pH curve of saliva obtained under the open mode was characterized by a single peak, whereas that of the substitute solution containing HCO3- was a monotonous rise. Thus, the following three parameters, which were considered to be representative of each pH curve were measured: pH1, which was the steady pH value at 1 min after the start of measurement under the covered mode; ΔpHI, which was calculated as the difference between pH5 and pH1 after the measuring mode had been changed from covered to uncovered at 1 min; and ΔpHL, which was calculated as the difference between pH15 and pH5.  The ΔpHI and ΔpHL are index numbers of inverse ratio of hydrogen concentrations between two time points. These pH changes mean accompanying the escape of CO2 during the measurement period, and if the value of them is + 0.3, it means
that the hydrogen ion concentration has decreased by half.
The ΔpHI and ΔpHL are index numbers of inverse ratio of hydrogen concentrations between two time points. These pH changes mean accompanying the escape of CO2 during the measurement period, and if the value of them is + 0.3, it means
that the hydrogen ion concentration has decreased by half.
Since the size of ΔpHI depends on the concentration of HCO3- in a logarithmic manner (Fig. 2B), difference in this value of saliva reflects differences in the concentration of HCO3- in the saliva sample, if the value of pH1 is approximately constant.
Therefore, it is possible to estimate outline of the saliva pH curve and changes in HCO3- concentration with these 3 variables, and moreover statistical investigation
can be done.
Variations in pH1, ΔpHI and ΔpHL among individuals.
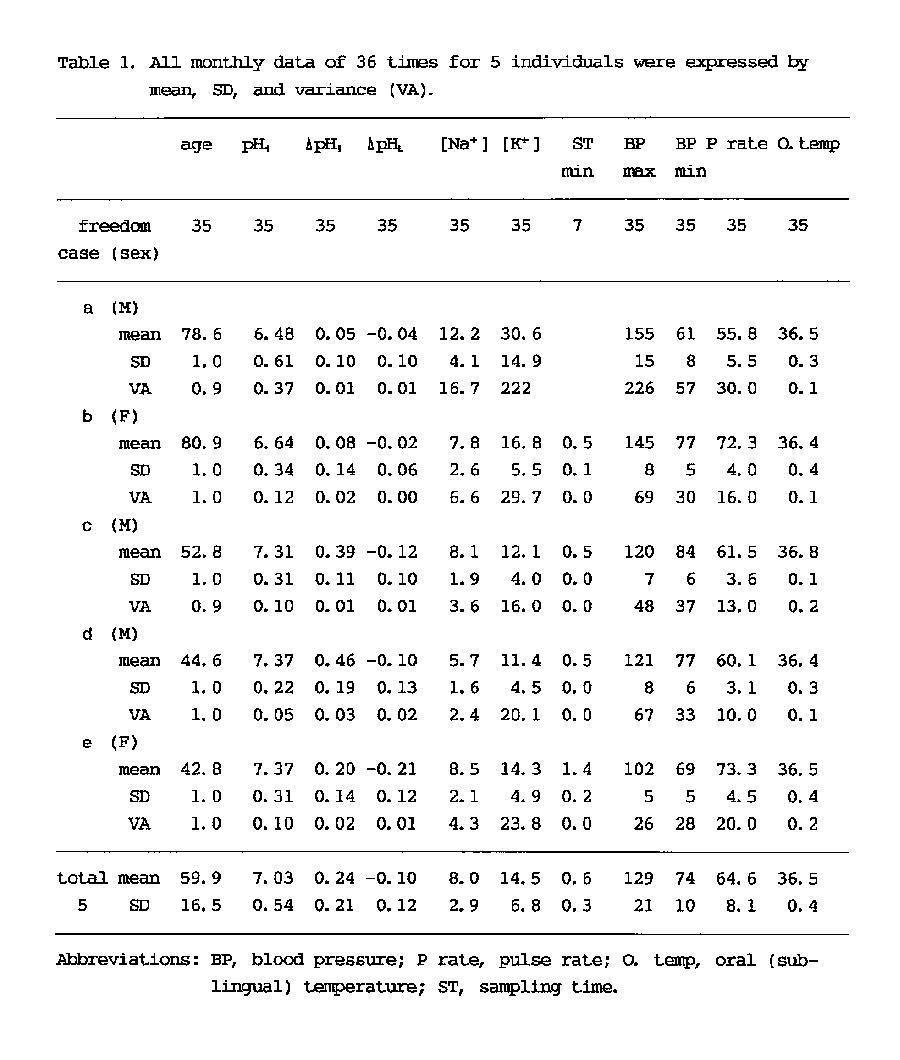
Variations in these three parameters among individuals were investigated. Table 1 shows the data of five adults in the average and the standard deviation (SD) of 36 time measurements. The results of one-way ANOVA showed that the variance of all of the
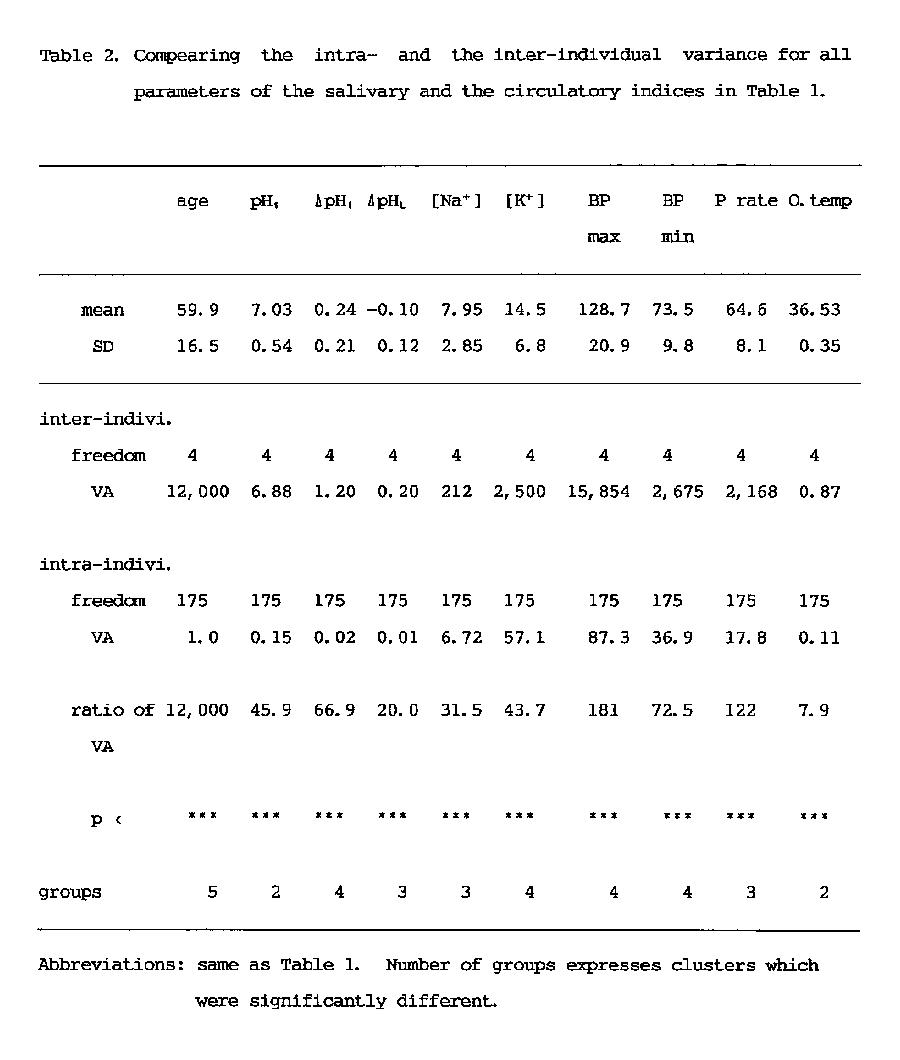
individuals was significantly (p<0.001) smaller than that of all measured values (Table 2). Since the number of groups in the table means the discriminated number of individual data as a significantly different each other, it can be said that the most discriminative salivary parameters were ΔpHI (Fig. 3) and K+ concentration (Fig. 4) same as blood pressure, and that the lowest salivary parameter was pH1 same as oral temperature (Table 2). The median discriminative salivary parameters were ΔpHL and Na+ concentration, same as pulse rate.
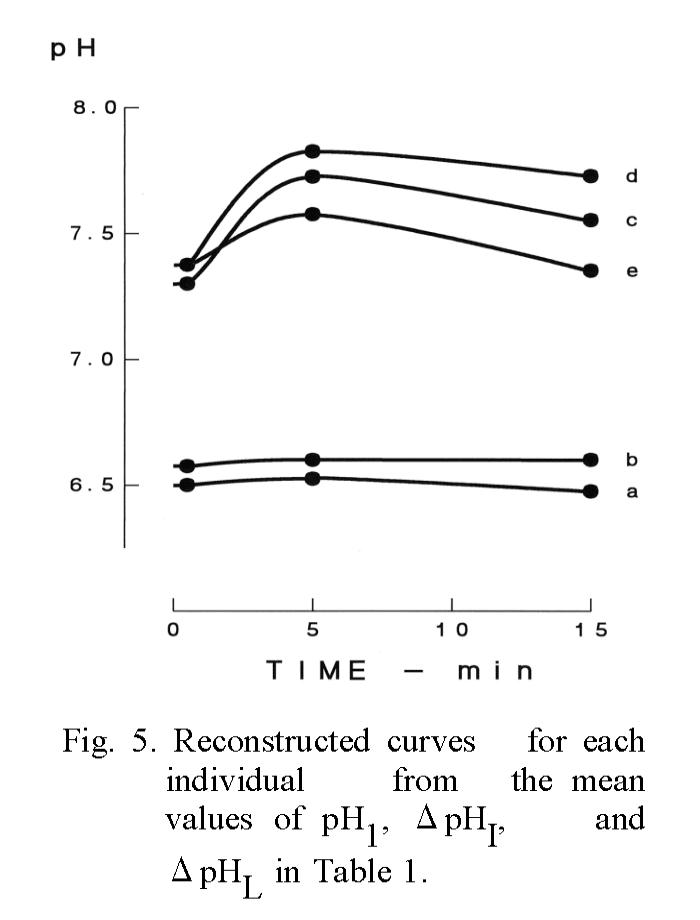
Reconstruction of the pH curve.
As the most discriminative parameters are ΔpHI and ΔpHL and these parameters seem to be intrinsic values of each individual, it was attempted whether the reconstructed pH curve from the average of the three pH variables of each individual could be discriminable or not (Fig. 5).
Among the three parameters of five individuals, pH1 was possible to discriminate only two groups of the a-b and the c-d-e but the curve groups reconstructed with ΔpHI and ΔpHL were distinguishable each other except the a-b group as shown number of groups in Table 2. Also, the results indicate that the difference of each individual in ΔpHI, i.e., the difference in the secretory function of HCO3-, seems to have been maintained over the 36-month period under a healthy condition.
Seasonal changes in measured values.
Statistical investigation by one-way ANOVA using data obtained from 5 adults over a period of 9 years (not shown in the table) showed that there were no seasonal differences in pH1, ΔpHI, blood pressure, and pulse rate but that there were seasonal differences in ΔpHL, Na+, K+ and oral temperature. The absolute values of ΔpHL, oral temperature, and Na+ concentration increased from spring to summer and then decreased from fall to winter. There were significant differences between those values recorded in summer and in winter (p<0.01). Also, the K+ concentration of saliva had a similar tendency but significance was staying in the level, which could not be denied (0.05<p<0.1).
Distribution of three variables of the saliva pH curve in a large group.
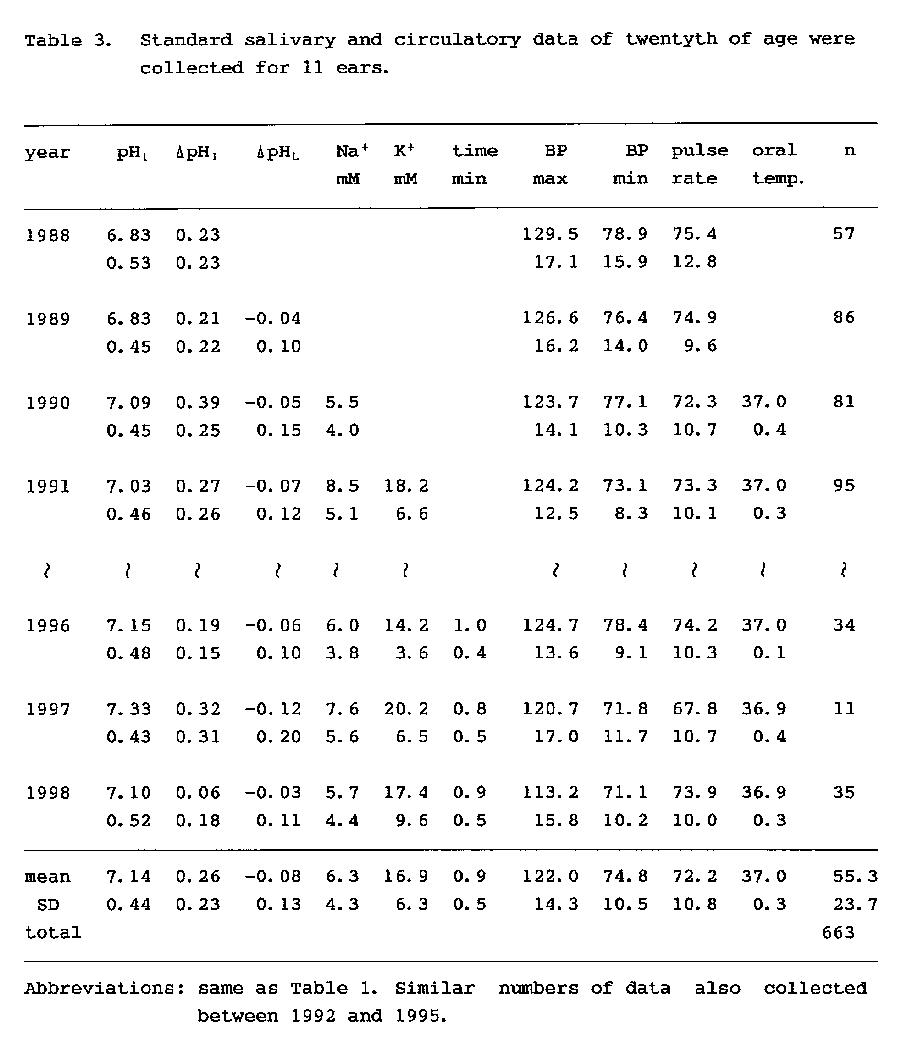
In 663 dental students, the distribution of three pH variables of saliva, Na+ and K+ concentrations, blood pressure and oral temperature, was investigated (Table 3). The mean values of this large group were similar to the mean values shown in Table 1. Also, although it is not in the table, there were no differences between the saliva variables in male and female subjects. In addition, the sampling times of the saliva were measured among 80 dental students (Table 3), and the mean (±SD) sampling time was 0.9±0.5 minutes.
Discussion
There have been many studies showing that analysis of saliva sample is a convenient means for assessment of physiological condition (23), evaluation the serum concentration of medicine (24-25) and assessment of the severity of an illness (26). The present saliva inspection for three variables of the pH curve and for electrolytes also convenient method to assess the physiological condition of each individual. Therefore, in the present study, it has been investigated about statistic characteristics of each parameter and discussed its physiological meaning in the following sections.
Saliva as an inspection sample and properties of the measured values.
Since measured values of saliva, such as pH and concentrations of Na+ and K+ in resting saliva and reflex saliva are different (27-28), it is difficult to prevent contamination of reflex saliva occurring spontaneously when a relatively large amount of resting saliva is collected over a period of 10 minutes. However, since the mean sampling time in the present study was only 0.9±0.5 minutes, the possibility of contamination by reflex saliva could be excluded. It has also been reported these values fluctuate with circadian rhythm (29), but this fluctuation was minimized in the present study by performing measurement within the same clock time for subjects having regular sleep and awake cycles.
It has been reported by many researchers that saliva is a convenient sample for estimating serum concentrations of the medicine (24-25) and hormones (30-31). However, it is only used as inspection of the Sjögren's syndrome (26) but it is rarely used even in case of the salivary calculus (32) or other salivary gland diseases.
Nevertheless, the author and coworkers have considered that the pH curve of saliva shown in Fig. 2A might represent the characteristics of each individual and also indicate the psychosomatic condition of each individual (33). In the present study, it was clarified statistically that salivary parameters such as ΔpHI and concentrations of Na+ and K+ are discriminable indices of each individual as blood pressure and pulse rate. Although there are individual differences in the crest time for the saliva pH curve (15), one can imagine the outline of the curve by the three convenient variables of pH1, ΔpHI and ΔpHL (Fig. 5).
According to Ferguson, the pH and concentration of electrolytes in resting saliva varies according to the circadian rhythm (29). On the other hand, it has been reported that there is little difference in salivary parameters measured between meals in the daytime (4,14). Thus, it may possible to obtain valuable data for monitoring health condition and elapse of medical treatment (33).
Three variables that characterize the difference in the pH curve of each individual.
After the measuring mode has been changed from covered to uncovered, the pH curve of the substitute solution rose monotonously, whereas that of the saliva showed a single peak. As shown in Table 3, polarity of salivary ΔpHI is positive, while that of ΔpHL is negative. Therefore, the pH curve of saliva generally has a single peak.
The pH1 is the steady pH value of saliva that is measured at 1 min from the start of recording under the condition in which escape of CO2 from the sample is blocked by a plastic plate. Although the steady value of pH is obtainable after 30 seconds from the start of recording (Fig. 1C), it shows a gradual shift towards alkalinization in several minutes if the initial concentration of NaHCO3 is high, as it is in the lacrima (19).
The 2nd variable, ΔpHI, is the difference between pH5 and pH1. The pH5 is measured at 5 min from the start of recording in the uncovered mode and is found to be nearly equal to the peak value of the pH curve. The ΔpHI means physicochemically the index of relative ratio of H+ concentrations of two time points. However, this value is also the variable that depends on HCO3- concentration in the sample as shown in Fig. 2B, and the value indicates physiologically the buffering ability of the saliva and also indicates the activity of carbonic anhydrase involved in HCO3- secretion (34). Therefore, it is a convenient value to roughly estimate the composition of saliva and to evaluate the secretory function of the salivary gland. According to the nomogram that was made from Fig. 2B, if pH1 of the saliva is 7 and ΔpHI is 0.3, then the initial concentration of NaHCO3 is estimated to be 2.2 mM.
The 3rd variable, ΔpHL, is change in pH in the uncovered mode, which occurrs after the buffering ability has declined since the escape of CO2 ended at approximately 5 min after start of recording. As shown in Table 3, the polarity of salivary ΔpHL is negative. This negativity is thought to be due to acid production by raw microorganisms in the sample (35). In addition, another partial cause of this negativity is thought to be the presence of carbonic anhydrase in the saliva (36) because of acceleration in the chemical reaction of CO2 + H2O←→H2CO3←→H+ + HCO3- (37).
Among the three variables, pH1 is low in discrimination ability but ΔpHI is a suitable index for identifying the differences between individuals. Although it has been assumed so far that ΔpHI and [K+] are important variables for evaluation of secretory function of tear fluid (19-20) and that classification of symptom by those values is a convenient method for determining the appropriate treatment for dry eyes (21), this has been confirmed statistically in this paper.
Determination of the saliva sample being resting saliva.
It is easy to imagine an approximate pH curve of saliva from the three pH variables, but it is difficult to determine whether the sample is actually resting saliva, because feature of the pH curve is different each other in every individual. According to Dawes, Na+ concentrations of parotid (27) and submandibular (28) saliva are lower than 10 mM in the resting state, and these concentrations increase to over 60 mM in the case of reflex saliva. Thus, the measurement of Na+ concentration has added (Table 3) to determine that the sample is actually collected during resting state. However, visual inspection of the oral cavity is important to prevent contamination of blood or interstitial fluid containing 145 mM Na+ from an inflammation site if the concentration of Na+ is unusually high.
Seasonal changes in variables of salivary pH and electrolytes.
As for seasonal changes in salivary components, it has been reported that there is no significant difference in the concentrations of IgA and lysozyme (LYS) in the saliva, though the concentrations of IgG and IgM in plasma reaches maximal after summer, and the concentration of LYS reaches maximum after winter (38). In the present study, seasonal differences in pH1 and ΔpHI were not found, but there were seasonal changes in ΔpHL, concentrations of Na+ and K+, and oral temperature.
pH variables and aging.
Functional decay of the salivary glands with aging has been found in animal experiments (39). However, the results of studies on humans are different: functional decay was observed in two studies (40-41), while no significant decay was found in healthy aged subjects in another study (42). A comparison of the data in Table 1 obtained from aged subjects with the data in Table 3 obtained from young subjects shows that there is no remarkable difference between them, supporting the latter report.
In conclusion, the statistical data of both aged and young healthy subjects seem to provide useful data when analyzing the measured values obtained from a patient of various diseases (21, 33).
Acknowledgements
This research was supported in part by Grants-in-Aid for High Performance Biomedical Materials Research from the Ministry of Education, Culture, Sports, Science and Technology, Japan. The author thanks Mrs. Shizuko Urata for her secretarial help.
References
1. Starr HE. Studies of human mixed saliva. II. Variations in the hydrogen ion concentration of human mixed saliva. J Biol Chem 54: 55-64, 1922.
2. Wah Leung S. A demonstration of the importance of bicarbonate as a salivary buffer. J Dent Res 30: 403-414, 1951.
3. Lilienthal B. An analysis of the buffer system in saliva. J Dent Res 34: 516-530, 1955.
4. Ericsson Y. Clinical investigations of the salivary buffering action. Acta Odont Scand 17: 131-165, 1959.
5. Frostell G. A colourimetric screening test for evaluation of the buffer capacity of saliva. Swed Dent J 4: 81-86, 1980.
6. Ericson D, and Bratthall D. Simplified method to estimate salivary buffer capacity. Scand J Dent Res 97: 405-407, 1989.
7. Heintze U, Birkhed D, and Björn H. Secretion rate and buffer effect of resting and stimulated whole saliva as a function of age and sex. Swed Dent J 7: 227-238, 1983.
8. Wikner S and Söder P-Ö. Factors associated with salivary buffering capacity in young adults in Stockholm, Sweden. Scand J Dent Res 102: 50-53, 1994.
9. Heintze U. Secretion rate, buffer effect and number of lactobacilli and Streptococcus mutans of whole saliva of cigarette smokers and non-smokers. Scand J Dent Res 92: 294-301, 1984.
10. Sato TP. Value in pH change of saliva in the aerial open space and physiological characteristics. Proc IUPS (Helsinki) 17: P2256, 1989.
11. Kotani H and Tomita K. Measuring method for concentration of ions, etc. (direct translation) Patent Gazette Jpn S63-148159, 1988.
12. Kotani H and Tomita K. Measuring method of physicochemical characteristics by way of forming a very thin layer. (direct translation) Patent Gazette Jpn S64-12259, 1989.
13. Sato TP. Transient phenomenon pH meter. Utility Model Gazette Jpn H02-146361, 1990.
14. Sato T. Modification of a simple device for measuring pH: demonstration of stable pH values and diurnal variation in human mixed saliva. Jpn Oral Biol 33: 281-288, 1991.
15. Shimazaki N, Yamamori T, Shioyama T, Ishibashi K, Sato T, and Suzuki TA. Measurement conditions and method of analysis of the saliva pH curve. Jpn Soc Psychosom Dent 8: 11-18, 1993.
16. Shimazaki N, Yamamori T, Ogasawara A, Kawada T, Okino K, Shioyama T, Ishibashi K, and Sato T. The effect of stress on salivary pH and autonomic responses. Jpn Soc Psychosom Dent 8: 37-44, 1993.
17. Sato TP. Correlation between bone mineral density of the radius and concentration of ions in the human resting saliva. Dent J Iwate Med Univ 21: 41-50, 1996.
18. Sato TP. Effect of aging factor on the correlation between bone mineral density of the radius vs. pH and [K+] of the human resting saliva. Dent J Iwate Med Univ 21: 197-204, 1996.
19. Sasaki K, Yoshimura Y, Tazawa Y, and Sato T. Stable pH value and time-dependent change in pH in the domain of ophthalmology. Folia Ophthalmol Jpn 43: 1413-1418, 1992.
20. Sasaki K, Sato T, Sasaki Y, Tazawa Y, and Yoshimura Y. Changes in pH, ΔpHI, [Na+], and [K+] of human basal and reflex tears. Atarashii Ganka (J Eye) 11: 1219-1221, 1994.
21. Sasaki Y and Sato TP. Correlation between secretion rate and electrolyte concentration of human tears, and classification of patients with decrease in basal tear secretion. J Jpn Ophthalmol Soc 102: 42-48, 1998.
22. Declaration of Helsinki. Brit Med J 2: 177, 1964.
23. Loewit K, Hoppichler F, and Lederm ller G. Ovulation prediction from cyclic changes in salivary electric conductivity. Am J Obstet Gynecol 163: 708-710, 1990.
24. Zuidema J, Höld KM, de Boer D, and Maes RAA. Saliva as a specimem for therapeutic drug monitoring in pharmacies. Pharmacy World Sci 18: 193-194, 1996.
25. Haeckel R and Hänecke P. Application of saliva for drug monitoring. An in vivo model for transmembrane transport. Eur J Clin Chem Clin Biochem 34: 171-191, 1996.
26. Atkinson JC, Travis WD, Pillemer SR, Bermudez D, Wolff A, and Fox PC. Major salivary gland function in primary Sjögren's syndrome and its relationship to clinical features. J Rheumatol 17: 318-322, 1990.
27. Dawes C. The effects of flow rate and duration of stimulation on the concentrations of protein and the main electrolytes in human parotid saliva. Archs Oral Biol 14: 277-294, 1969.
28. Dawes C. The effects of flow rate and duration of stimulation on the concentrations of protein and the main electrolytes in human submandibular saliva. Archs Oral Biol 19: 887-895, 1974.
29. Ferguson DB, Fort A, Elliott L, and Potts AJ. Circadian rhythms in human parotid saliva flow rate and composition. Archs Oral Biol 18: 1155-1173, 1973.
30. Fenske M. The use of salivary cortisol measurements for the non-invasive assessment of adrenal cortical function in guinea pigs. Exp Clin Endocrinol Diabetes 105: 163-168, 1997.
31. Nicolson N, Storms C, Ponds R, and Sulon J. Salivary cortisol levels and stress reactivity in human aging. J Gerontol Med Sci 52A: M68-M75, 1997.
32. Isacsson G, Ahlner B, and Lundquist PG. Chronic sialadenitis of the submandibular gland. Arch Otorhinolaryngol 232: 91-100, 1981.
33. Mikami K and Sato TP. Clinical observation of the variation in psychosocial stress and the early change in pH of the resting saliva in a patient of hyperventilation syndrome with dysgeusia. Psychosom Med Jpn 4: 51-55, 2000.
34. Sato TP. A model of saliva secretion considering the role of carbonic anhydrase. J Jpn Sliv Gl 42: (in printing)
35. Ogasawara A, Shimazaki N, Yamamori T, Shioyama T, Ishibashi K, Tajika S, and Kaneko M. Evaluation of the saliva pH curve and its application regarding the effects of oral bacteria. Jpn Soc Psychosom Dent 9: 1-6, 1994.
36. Parkkila S, Parkkila A-K, Vierjoki T, Ståhlberg T, and Rajaniemi H. Competitive time-resolved immunofluorometric assay for quantifying carbonic anhydrase VI in saliva. Clin Chem 39: 2154-2157, 1993.
37. Davenport HW. Gastric carbonic anhydrase. J Physiol 97: 32-43, 1939.
38. Wagner V, Wagnerova M, Wokounova D, and Kriz J. Seasonal and sex-related changes in the levels of immunogrobulins and lysozyme in a semicohort of children during a three-year period. J Hygiene Epidemiol Microbiol Imjmunol 26: 187-203, 1982.
39. Rajakumar G and Scarpace PJ. β-Adrenergic signal transduction in aging parotid and submandibular salivary glands. J Gerontol 46: B249-B251, 1991.
40. Pedersen W, Schubert M, Izutsu K, Mersai T, and Truelove E. Age-dependent decreases in human submandibular gland flow rates as measured under resting and post-stimulation conditions. J Dent Res 64: 822-825, 1985.
41. Cowman RA, Frisch M, Lasseter CJ, and Scarpace PJ. Effects of beta-adrenergic antagonists on salivary secretory function in individuals of different ages. J Gerontol 49: B208-B214, 1994.
42. Ship JA, Nolan NE, and Puckett SA. Longitudinal analysis of parotid and submandibular salivary flow rates in healthy, different-aged adults. J Gerontol 50A: M285-M289, 1995.
A model of saliva secretion considering the role of carbonic anhydrase Return to
Index
Tadasi P. Sato
(Department of Oral Physiology, School of
Dentistry, Iwate Medical University)
It has been reported the following functional models as representing a lot of research works on the salivary glands: one of a model for the electrolyte fluid secretion (1) and the other for the secretion of the macromolecules such as amylase (2). However, there are few reports about secretion of the carbonic ion in the acinus region except the model that Melvin et al. (3) proposed and that Turner (4) quoted.
It had paid attention since Yoshimura (1953) reported that carbonic anhydrase (CA) was important for the saliva secretion. However, it was in the limelight since Feldstein & Silverman reported in 1984 that CA was present in the saliva of the rat but its molecular structure was different from that of CA-II, and then it was identi-fied as CA-VI (described in reference (5)). On the other hand, it was reported that secretion of the parotid saliva at the time of the rest decreased by 87 % as the effect of the CA blocker but which had no influence in case of the submandibular gland of the red kangaroo (6). However, when thinking the report (7) that the CA density in the submandibular gland was 1/6.5 of the parotid in the dog, one may think that the validity of CA in salivary secretion is not so small.
So, with referring to the chemical reaction catalyzed by CA (upper half of Fig. 1)and the data of gas metabolism (lower left of Fig. 1) on the submandibular gland at rest which reported by Murakami (1981) (8), and with the rough estimation of chemical concentration (lower right of Fig. 1) when one-third of the produced CO2 was supposed to be contained in the saliva at rest, it was assembled the secretion model (Fig. 2) of carbonic ion which includes the acinus and the intercalated duct.
Based on the report by Murakami's (8) that the respiratory quotient of salivary gland at rest is 1, the present model expresses the following sequences: 1)CO2 which was formed by glucose metabolism becomes H2CO3 by the cytosol type of CA-II and 2/3 of the CO2 may be produced within the acinus region. 2) one-half of the H2CO3 produced in the acinus would be discharged through the ion exchanger in the
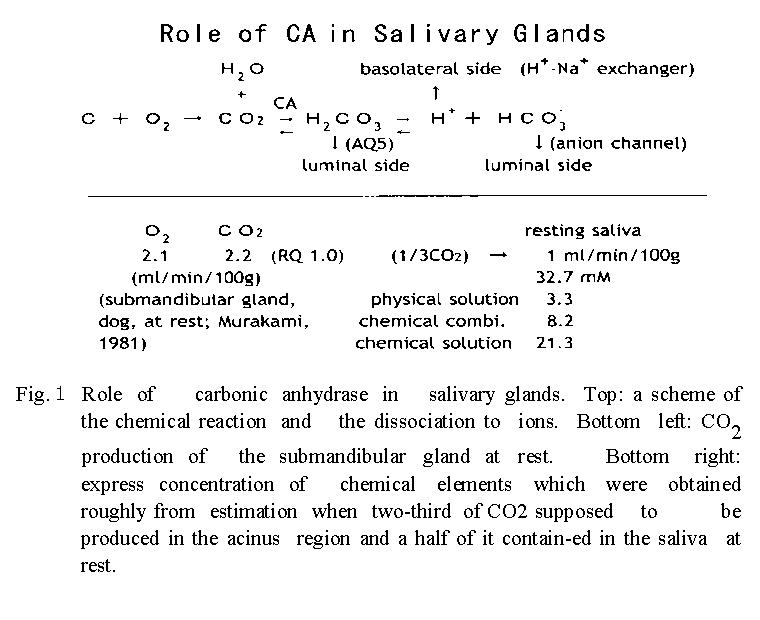
basolateral membrane after dissociation to proton and carbonic ion, while another one-half of H2CO3 may flow out into the luminal cavity through the water channel in the luminal membrane. 3) the latter H2CO3 which came out in the luminal side may contribute to rise in osmotic pressure after dissociation. 4) on the other hand, it may return to the form of CO2 due to the catalytic action of the secretory type CA-VI, and the CO2 may diffuse to the outside of the intercalated duct and collected to venous blood through capillaries since metabolic rate in the intercalated duct is presumed to be low.
Although this model is different from that of Melvins' (3) in several points, the present model includes the role of secretory type CA (CA-VI) and could explain the clinical results of zinc treatment (9). However, to do the correction and to verify the validity of this model, a lot of experiments should be necessary and the future research is waited for.
A part of this research was supported by Grants-in-Aid for High Performance Biomedical
Materials Research from the Ministry of Education, Science, Sports and Culture, Japan.
References
1. 西山明徳:外分泌細胞の生理学 -外分泌機構とその異常-. 日本臨床 44: 1948-1499、 1986.
2. 田隈泰信:耳下腺アミラ−ゼ分泌における細胞内情報伝達機構 -SNARE仮説との接点- 日唾誌 37: 1-9、 1996.
3. Melvin, JE, Moran, A, and Turner, RJ: The role of HCO3- and Na+/H+ exchange in the response of rat parotid acinar cells to muscarinic stimulation. J Biol Chem 263: 19564-19569, 1988.
4. Turner, RJ: Mechanisms of fluid secretion by salivary glands. Ann NY Acad Sci 694: 24-35, 1993.
5. Sato, TP: Secretion mechanism of the saliva and clinical methods of analysis. J Jpn Saliv Gl 41: 1-9, 2000.
6. Beal, AM: The effect of carbonic anhydrase inhibitors on sec-retion by the parotid and mandibular glands of red kangaroos Macropus rufus. J Comp Physiol 161: 611-619, 1991.
7. Maren, TH: Carbonic anhydrase: Chemistry, Physiology, and Inhi-bition. Physiol Rev 47: 595-781, 1967.
8. 村上政隆:イヌ顎下腺の分泌過程における熱産生と腺血流量そしてO2消費 CO2産生.日本生理誌 43: 135-147, 1981.
9. 田中正美:味覚障害患者における唾液腺分泌機能−亜鉛欠乏と唾液腺分泌機能との関連性について−.日耳鼻 97: 485-493, 1994.
Chapter 2
Recovery of a patient with a recurrent relapse of dysgeusia monitored by salivary variables and serum zinc content
Tadasi P. Sato
Department of Oral Physiology, School of Dentistry, Iwate Medical University
Kazuharu Mikami
Department of Internal Medicine III, School of Medicine, Iwate Medical
University
Address for Correspondence: Tadasi P. Sato, Department of Oral Physiology, School of
Dentistry, Iwate Medical University, Chuo-dori1 - 3 - 27, Morioka, 020-8505, Japan
E-mail address: tpsato@iwate-med.ac.jp
Index of jump to the following contents:
Disappearance of the phantom sweetness symptoms and salivary parameter of ΔpHI and the Na+ concentration.
Abstract
A monthly inspection of resting saliva was performed, as well as psychotherapy, for a patient with dysgeusia of phantom sweetness. In the first saliva inspection, there was an indication to suspect a decline in the serum zinc concentration and carbonic anhydrase activity. This decline was later supported by a chemical analysis of the blood. When the patient enhanced her nutritional intake and her weekly exercise, her serum zinc concentration rose and her symptoms improved. When the concentration of her saliva Na+ increased, the disappearance and reappearance of the phantom sweetness symptom repeated and she was advised to maintain a medium level of Na+, which contributed to about a one-year continuous disappearance of the phantom sweetness. This paper reports the correlation between the patient's recurrence of phantom sweetness symptoms, her saliva Na+ concentrations, her work-related stress, her diet, and her exercise regime.
Key words: phantom sweetness, carbonic anhydrase, corticoids
OUR FACILITIES for measuring the saliva of a patient whose psychosomatic illness is triggered by mental stress are limited to a single, out patient clinic (1) where the relationship between a decrease in activity of the carbonic anhydrase (CA), one of zinc containing metaloenzymes, and serum zinc content was studied. Other reports have shown a high rate of improvement of the CA VI-gustin deficiency of patients with dysgeusia and dysosmia (2) and also of the dysgeusia (3) when patients take a zinc pill supplement.
Since similar results were obtained by Tanaka (4), and Kitago and Tomita (5), we tried a nutritional approach to increase the serum zinc concentration of a patient who complained about symptoms of phantom sweetness (1). The present paper reports a case where phantom sweetness symptoms, which had a history of alternate disappearance and reappearance, maintained a steady disappearance over 10 months once a significant correlation was established between the phantom sweetness symptoms and the patient's concentration of saliva Na+, with a phase difference of one month.
Materials and Methods
Subject: No.980078, a 47-year-old female, employed in a parts manufacturing company, whose precise medical records were reported and available (1). For the past twelve years, this female frequently missed work due to ill health. During this time, she was evaluated by four hospitals that were unable to offer an accurate diagnosis. Right before visiting our hospital, she was diagnosed with hyperventilation syndrome by the first aid department of another hospital. One week later, with a morning appearance of a phantom sweetness symptom, she visited our clinic. Initially, her systemic condition improved during three months of psychosomatic treatment. However, dysgeusia and dry mouth symptoms persisted and so we began a study of saliva inspection.
Verbal and salivary records at the first saliva inspection. The patient complained of tiredness, entire days of phantom sweetness symptoms, and a decrease in salt sensation. She also had a lower than normal mastication efficiency due to irregular dentition and habitual fast eating with one index of the salivary pH curve, ΔpHI (6) apparently reflecting a lower activity of CA.
Measurement of saliva. The following saliva measurement was performed once a month at approximately the same time of day in order to minimize circadian fluctuations. A resting saliva sample of about 100 μl was collected by using two sheets of neutral paper slips (15 x 10 mm2, YO-11, HORIBA, Jpn) placed between the dorsal tongue and the palates. The approximate sample collecting time of the resting saliva was measured in increments of 0.5 min. The resting saliva on one paper slip was used to measure the following pH variables which represent a pH curve of the sample, while saliva on the other paper slip was used to measure concentrations of Na+ and K+. For recording the saliva pH curve, a pH meter equipped with a flat-type pH sensor (model C-1, HORIBA, Jpn) was mounted with a plastic plate, which was adapted to cover the sample surface (7). The pH variables of pH1, ΔpHI, and ΔpHL were measured as follows: initially, the surface of the sample was covered with the plastic plate to block escape of CO2 during a 1-minute recording of a steady pH of the sample as pH1. Afterwards, the plastic plate was removed from the sample and allowed a CO2 escape, and the initial pH change between one and five minutes was measured as ΔpHI (= pH5 - pH1), and the late pH change between five and fifteen minutes was measured as ΔpHL (= pH15 - pH5). Concentrations of Na+ and K+ in the sample were measured with ion meters (models of C-122 & C-131, HORIBA). Blood pressure, oral temperature and the intermittent serum zinc measurements were also taken.
Evaluation of phantom sweetness. On an analog scale of 6.5 cm, where grade one is the lowest threshold of the phantom sweetness symptom and grade five indicates that hospital admission is necessary, the patient was asked to estimate and mark her subjective awareness of the strength of the phantom sweetness symptom between zero and five.
A computer PC9821Nr15 (NEC, Jpn) and spreadsheet program, ALL IN ONE (TES INTERNATIONAL, Jpn), were used to analyze the data within the critical t-test region, and to identify whether or not there was a significant correlation between phantom sweetness and the measured variables. Significance was judged by the two-tailed test with a 5% error probability.
This research was based on the Helsinki Declaration (8) and done according to the principle of informed consent.
Results
Clinical record and change in salivaryΔ pHI and the Na+ concentration.
Observation in the primary period (Apr/'98-Aug/'99). The first noticeable sign of the patient was a low value of her ΔpH
I and irregular dentition. In addition to her psychosomatic stress, her low efficiency in mastication seemed to increase the probability that a low activity of CA was due to a decrease in serum zinc content. A conclusion partially supported by the data showing her zinc concentration level at 83 μg/dl. Accordingly, the patient was taught how to improve low mastication efficiency by her irregular dentition. She was also advised to increase her intake of foods containing zinc (9-11) by 20%.
The course of phantom sweetness symptoms in the initial 16 months is shown in figure 1, with a brief data report on panels A and B (1). After two months (Jun/'98) of counseling, the patient's physical condition improved and the phantom sweetness symptoms declined (Fig. 1A). The value of ΔpH
I increased to the young adult average (unpublished data) shown by the broken line (Fig. 1B). Four months later (Aug/'98), the patient was re-employed in her previous position at the parts manufacturing facility.
The patient's saliva ΔpHI value declined in the summertime (Jul-Aug/'98), then rose again in November ('98). At the same time, the phantom sweetness symptoms disappeared and the serum zinc content was measured at 88 μg/dl, with a 6% rise. However, frequent jobs shifts within the factory precipitated more psychosomatic stress and the symptoms of phantom sweetness reoccurred (Jan/'99). During this time, the patient's serum zinc content temporarily rose to about 40% in February of 1999, then declined close to the first level (Apr/'98, 83μg/dl) in May of 1999, and the phantom sweetness symptoms rose remarkably level 4. After she began her new job, there was a rise in the ΔpHI level and the phantom sweetness symptoms declined to zero in Aug 1999 as her work-related stress levels also dropped.
A positive correlation was observed between the patient's sensation of phantom
sweetness and the concentration of salivary Na+ (Fig. 1C), which accompanied the fluctuations of the phantom sweetness symptoms. An abrupt increase in Na+, observed in August 1999, seemed to indicate that the phantom sweetness symptoms had returned even though the sweetness had disappeared completely. Unfortunately, it was correct. In order to reduce the phantom sweetness symptoms, it seemed necessary to maintain a concentration of Na+ equal to young adult average (dashed line in Fig. 1D, (unpublished data)), as well as maintaining a normal level of ΔpHI (ie, 0.26). The patient was advised to exercise by walking for one-hour a week in order to increase her Na+-uptake in the salivary glands by increasing the secretion of corticoids. The relapse and improvement after that is shown in Fig. 2.
The latter relapse and observation in the secondary period (Sep/'99 - Sep/'00). The phantom sweetness symptoms reappeared again in September 1999 and in October 1999 stress in factory. At this time, the symptoms equaled the same level reported during the first (Apr/'98) saliva inspection (Fig. 2A). The saliva Na
+ concentration showed a high value with the ΔpH
I = 0.3-0.5. From Oct 99 to Jul 2000 the value of ΔpH
I was above the young adult average (Fig. 2B) and the patient was able to continue her normal work hours. The phantom sweetness symptoms disappeared in November 1999 and the value of Na
+ concentration also decreased to the young adult average after December 1999 (Fig. 2C). The disappearance of the phantom sweetness symptoms continued for 10 months. The serum zinc content was in the range of 94 - 101 μg/dl, and the value of ΔpH
I was constantly over the dashed line, except when the patient became exhausted by working overtime for one month during (Jun - Jul/'00). Also, the saliva collecting time (Fig. 2D) was conducted at 0.5-minute intervals and the patient's saliva secretion was better than during the primary period (ie, Apr/'98 to Jun/'99) in Fig. 1D.
While comparing the panel B-D in Fig. 1 and in Fig. 2, it was estimated that a fluctuation of the measured values decreased in the secondary period (Dec/'99 to Sep/'00. In addition, a significant difference was detected between the phantom sweetness symptoms, the saliva collecting time, and the diastolic blood pressure measured in the both periods (Table 1).
Correlation between the phantom sweetness symptoms and Na+ concentration of the saliva.
Out of 22 of the measured values taken up to December of 1999, 20 of these measured values were within the critical region (mean ± about 1 SD). These 20 data were then used
to analyze the normal distribution needed to determine if there was significant correlation between the phantom sweetness symptoms and the Na+ concentration. As shown in Table 2, there was a significant correlation between the phantom sweetness symptoms and the Na+ concentration, with an out-phase of one month (Fig. 3A), which was determined nonsignificant if both parameters were in phase (Fig. 3B).
Discussion
For treatment of dysgeusia, there are two opposite reports: one report indicates that dysgeusia is hard to cure (12), and the other indicates that dysgeusia is curable at a 70% rate with zinc treatments (3-5). In addition, it has been reported that taste alterations in liver cirrhosis are not due to zinc deficiency (13). Therefore, it is hard to choose a suitable treatment due to the difference between the kind of symptoms which can manifest on a case-by-case basis and the incurable rate that has been reported at 30%. The present case study shows that partial recovery of the phantom sweetness symptom was obtained by improving the patient's diet and increasing her serum zinc concentration; however, full recovery of the phantom sweetness symptoms only occurred after the patient increased her weekly exercise. The details of the present results are discussed in below.
Recovery, and relapse of a patient with recurrent dysgeusia.
A 47-year-old, female patient, who had been suffering from an unidentified disease for twelve years, visited an emergency department in a local hospital with an oppressive
sensation in her chest. The hospital diagnosed her as having a hyperventilation syndrome. A week later, she experienced a phantom sweetness sensation in the morning and subsequently visited our clinic. After analyzing her saliva ΔpHI and serum zinc concentration (1), we observed a decrease in CA activity. Her symptoms also included tiredness, a heavy feeling in her chest, a dry mouth, and a sensation of phantom sweetness. Her serum zinc content was initially measured at 83 μg/dl, well within the range of symptoms for dysgeusia as reported in Henken et al. (2), even though the value fell below the central value of 87.5 in Japanese.
After the patient improved her mastication habits and increased her intake of zinc containing foods by 20 % for four months, the value of ΔpHI rose and she was able to resume working at her job. Seven months later, a blood test showed increased levels in her serum zinc concentration, which also correlated with a decrease in her phantom sweetness symptoms.
Since zinc absorption in the intestine is affected by the efficiency of physical digestion in the oral cavity and the ionization by gastric juice, this patient was at risk for negative zinc absorption due to irregular dentition, fast eating, psychosomatic work-related stress, and a low secretion rate of gastric juice due to her low levels of serum zinc concentration and decreased activity of CA in her gastric gland. Her relatively small physical frame and body weight of 42 kg were both consistent with those observations. Her
physical condition improved once there was an increase in ΔpH
I and her serum zinc concentration.
After the patient's physical condition improved and she was reinstated in her job, the reoccurrence of the phantom sweetness symptoms disappeared. A statistic analysis showed a positive correlation between the strength of the phantom sweetness sensation and the concentration of Na+ in the saliva.
There was also a successful decrease in the patient's symptoms once she increased her exercise by one hour per week of walking. Since the saliva Na+ concentration changes are dependent on the Na+-reuptake (14-15), to the mean value for young adults, increasing the patient's exercise helped activate the striated ducts in her salivary glands, which is one of the target areas which release the corticoids needed to decrease Na+ concentrations in saliva.
Improvement of the patient's physical condition, disappearance of the dysgeusia symptom and analysis of the serum zinc content levels.
It has been reported that symptoms such as dermatitis, alopecia, emotional disorder, weight loss, taste abnormality, etc are observed after continuous zinc deficiency (16). Also, a decline in serum zinc concentrations has been shown to lower the activity of CA, along with 300 different kinds of enzymes, including those related to the synthesis of DNA and RNA (17). A part of zinc deficiency symptoms has been reported by researchers who fed a zinc deficient diet to rhesus monkeys (18) and rats (19).
On the other hand, improvement of dysgeusia and dysosmia (2-3), or of dysgeusia and xerostomia (4-5), has been reported when zinc treatment was introduced. There are research reports on rats which show that zinc deficiency influences the submandibular gland far more than other organs (20-21). This is consistent with the present case where improvement of the systemic condition and secretory function of the salivary glands increased as the serum zinc content increased. The serum zinc content of our patient during the second period of this study was 97.5 ± 5.0 μg/dl, which is the same as the value reported for the control group in Henken et al. (2). Although there are many reports to explain systemic symptoms by zinc deficiency and a decrease in CA activity, there is no precise explanation of how xerostomia occurs when the CA activity in the salivary glands is decreased. Thus a model of the secretion mechanism about this part reported in another article (Sato, in press) (22).
There are two ways to supplement a mild zinc deficiency. One is to ingest zinc tablets (3-5), and the second is to increase the intake of zinc rich foods along with efficient mastication habits. Since there are two reports which indicate central nervous system damage from zinc released trans-synaptically (23-24), we choose to increase the patient's intake of zinc rich foods along with efficient mastication habits instead of using zinc supplements. In order to minimize a possible zinc toxicity, we monitored the serum zinc content until the patient established a life style that included appropriate zinc rich food selection and exercise.
Disappearance of the phantom sweetness symptoms and salivary parameter of ΔpHI and the Na+ concentration.
Even though this study did not investigate the relationship between the strength of the phantom sweetness symptom and saliva electrolyte concentration, it has been recognized that the phantom sweetness tends to decrease in parallel with Na+ concentration during the observation period of this case (Fig. 1). Since Na+ concentration of the resting saliva depends on the re-uptake ability in the striated ducts (14), which in turn depends on the release of corticoids (25), it was predicted that there would be a correlation between the phantom sweetness symptom and the Na+ concentration. In the beginning of the second period of the study, the Na+ concentration increased and the phantom sweetness symptom reoccurred (Fig. 2). Once the patient increased her weekly exercise by one hour of walking, her Na+ concentration decreased to the young adult average and the phantom sweetness symptom declined for ten months. This confirmed a significant correlation between the phantom sweetness symptom and the patient's Na+ concentration levels, with the phase difference of one month. This phase difference between both parameters (Table 2) represents the lifetime of taste bud cells (26) and a delay till functioning.
This study investigated a case with a range of symptoms, including hyperventilation syndrome, dysgeusia of phantom sweetness, and dry mouth with a method of resting saliva analysis (27) and a recent knowledge about salivary secretion (28). This method can monitor a patient with dysgeusia based on the level of activity of CA--which depends on the serum zinc concentration--and of Na+-pump--which does not depends on the serum zinc concentration (16).
Even though the taste abnormality of phantom sweetness symptoms does not threaten a patient's life, it does increase the stress of daily life. Since the statistical results of this study support the resting saliva analysis, it is our hope that the findings presented here will be useful for the treatment of patients with dysgeusia.
Acknowledgments
The authors wish to thank Dr. Paul Langman for his help to prepare English manuscript and Mrs. Shizuko Urata for her secretarial help. This research was supported in part by Grants-in-Aid for High Performance Biomedical Materials Research from the Ministry of Education, Culture, Sports, Science and Technology, Japan.
References
1) Mikami K and Sato TP. Clinical observation of the variation in psychosocial stress and the early change in pH of the resting saliva in a patient of hyperventilation syndrome with dysgeusia. Psychosomat Med Jan 4: 51-55, 2000.
2) Henkin RI, Martin BM, and Agarwal RP. Decreased parotid saliva gustin/carbonic anhydrase VI secretion: an enzyme disorder manifested by gustatory and olfactory dysfunction Am J Med Sci 318: 380-391, 1999.
3) Henkin RI, Martin BM, and Agarwal RP. Efficacy of exogenous oral zinc in treatment of patients with carbonic anhydrase VI deficiency. Am J Med Sci 318: 392-404, 1999.
4) Tanaka M. Secretory function of the salivary gland in patients with taste disorders. J Otolaryngol Jpn 97:485-493, 1994.
5) Kitagoh H, and Tomita H. Healing process of taste receptor disturbance. J Otolaryngol Jpn 98: 267-280, 1995.
6) Sato TP. Value in pH change of saliva in the aerial open space and physiological characteristics. Proc IUPS (Helsinki) 17: 156, 1989.
7) Sato TP. Transient phenomenon pH meter. Utility Model Gazette DB Jpn H02-146361, 1990.
8) Declaration of Helsinki (English version). Brit Med J 2: 177, 1964.
9) Lopez P, Castaneda M, Loez G, Munoz E, and Rosado JL. Iron, zinc and copper content of foods commonly consumed in Mexico. Arch Latinoam Nutr 49: 287-294, 1999.
10) Ekmekcioglu C, Anderle H, Strauss-Blasche G, Steffan I, Feyertag J, and Marktl, W. Calcium, magnesium, copper and zinc content of menu components: Comparison of analysed with calculated values. Nahrung 43: 311-316, 1999.
11) http://www2.big.or.jp/~aiken/dic/a/a.html-(zinc)
12) Osaki T, Ohshima M, Tomita Y, Matsugi N, and Nomura Y. Clinical and physiological investigations in patients with taste abnomality. J Oral Pathol Med 25: 38-43, 1996.
13) Sturniolo GC, D'Inca R, Parisi G, Giacommazzi F, Montino MC, D'Odorico A, Soranzo P, and Maccarato R. Taste alterations in liver cirrhosis: are they related to zinc deficiency? J Trace Elem Electrolytes Health Dis 6: 15-19, 1992.
14) Martinez JR, Holzgreve H, and Frick A. Micropuncture study of submaxillary glands of adult rats. Pfl ger Arch 290: 124-133, 1966.
15) Mangos JA. Micropuncture study of postnatal functional maturation of the rat parotid. J Dent Res 57: 826-833, 1978.
16) Prasad, AS. Clinical endocrinologic, and biochemical effects of zinc deficiency. Special Topics in Endocrinology & Metabolism. 7: 45-76, 1985.
17) Brandao-Neto J, Madureira G, Mendonca BB, Bloise W, and Castro, AV. Endocrine interaction between zinc and prolactin. An interpretative review. Biol Trace Elm Res 49: 139-149, 1995.
18) Golub MS, Gershwin ME, Hurley LS, Baly DL, and Hendrickx AG. Studies of marginal zinc deprivation in rhesus monkeys. I. Influence on pregnant dams. Am J Clin Nutr. 39: 265-280, 1984.
19) Goto T, Komai M., Bryant BP, and Furukawa Y. Reduction in carbonic anhydrase activity in the tongue epithelium and submandibular gland in zinc-deficient rats. Int J Vitam Nutr Res 70: 110-118, 2000
20) Chaudhry IM, Gandor DW, and Gerson SJ. Reduction of carbonic anhydrase activity in the submandibular salivary glands of zinc-deficient rats. Arch Oral Biol 26: 399-402, 1981
21) Gandor DW, Fanslow DJ, and Meyer J. Effects of zinc deficiency on developmental changes in alkaline phosphatase and carbonic anhydrase activities in the submandibular gland of the rat. Arch Oral Biol 28: 609-615, 1983.
22) Sato TP. A model of saliva secretion considering the role of carbonic anhydrase. J Jpn Sliv Gl 42: (in printing).
23) Suh SW, Chen JW, Motamedi M, Bell B, Listiak K, Pons NF, Danscher G, and Frederickson CF. Evidence-that synaptically-released zinc contributes to neuronal injury after traumatic brain injury. Brain Res 852: 268-273, 2000.
24) Suh SW, Jensen KB, Jensen MS, Silva DS, Kesslak PJ, Danscher G, and Frederickson CF. Histochemically-reactive zinc in amyloid plaques, angiopathy, and degenerating neurons of Alzheimer's diseased brains. Brain Res 852: 274-278, 2000.
25) Kurihara K, Tajima Y, Kawasaki M, and Ueha T. Modulation of thyroid hormone-independent Na+, K+-ATPase induction in cultured human submandibular gland cell lines, HSG cells. Oral Oncol 35: 368-374, 1999.
26) Farbman AI. Renewal of taaste bud cells in rat circumvallate papillae. Cell Tiss Kinet 13: 349-357, 1980.
27) Sato TP. Modification of a simple device for measuring pH: demonstration of stable pH values and diurnal variation in human mixed saliva. Jpn J Oral Biol 33: 281-288, 1991.
28) Sato TP. Secretion mechanism of the saliva and clinical methods of analysis. J Jpn Saliv Gl 41: 1-9, 2000.
Management of Salivary Hypofunction with Nutritional Supplements
Tadasi P. Sato
Department of Oral Physiology, School of Dentistry, Iwate Medical University
Morioka, Japan
Index of jump to the following contents:
Abstract:
Monthly measurement of the resting saliva was performed in addition to psychosomatic therapy for patients visiting the clinic who were suspected of having decreased activity of carbonic anhydrase. According to the serum zinc content, patients were divided into a low serum Zn group (n = 22) and a mid-high serum Zn group (n = 12). Patients in the former group were advised to improve mastication efficiency and to consume more food with a high zinc content. After 6.6±5.6 months, serum zinc increased from 75.6 to 90.9 μg/dl in the former group, whereas no change was found in the latter group, though symptoms improved in the both groups. Improvement in salivary secretion was noticed in ΔpHI in the former group, and a decrease in K+ concentration was found in the latter group.
Introduction
It has been reported that about 70% of patients with taste abnomality showed improvement following zinc supplementation and that zinc supplementation improved hyposalivation in some patients (1-3). The author and coworkers previously reported a patient with dysgeusia who was monitored by salivary measurements and intermittent analysis of serum zinc content (4) after having been advised to improve mastication efficiency and to increase consumption of foods containing high zinc contents by about 20% (5-7). Improvement in the patient's dysgeusia was noticed after 7 months, and elevation of salivary variables and of serum zinc content were also noted. Although there have been some nutritional studies on hyposalivation in animals fed zinc-deficient diets (8-10), there have been no such studies using human subjects. Therefore, we continued the salivary measurements and intermittent analysis of serum zinc content, and statistically analyzed the collected data in view of the difference in subjective intensity of symptoms and in the serum zinc content.
Materials and Methods
Thirty-four subjects whose serum zinc content have been analyzed more
than twice were selected from 100 patients monitored by saliva measurements
and were classified into a low serum zinc (75.6±5.0 μg/dl) group
(6 males and 16 females; mean age, 42 ±13 years) and a mid-high
serum zinc (102.8±7.0 μg/dl) group (8 males and 4 females; mean
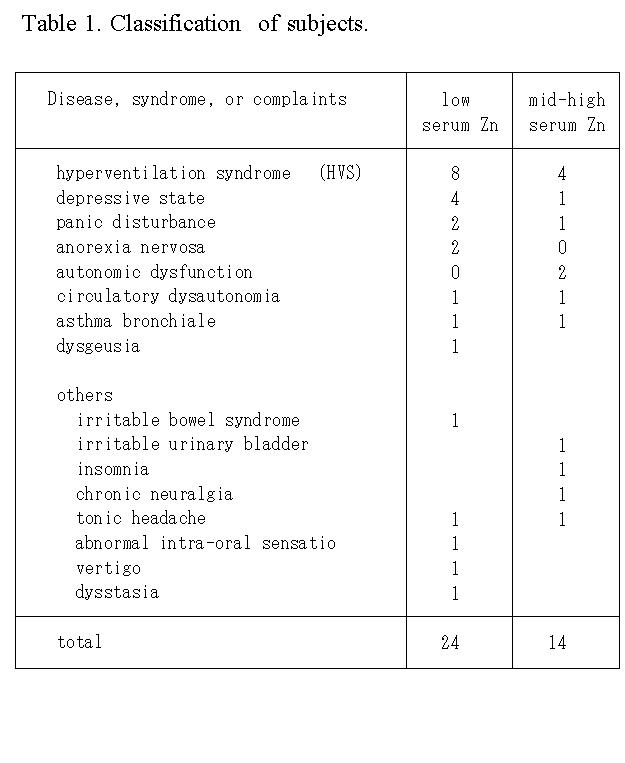
age 45 ±15 years). Their diagnoses and single or duplicated symptoms
are shown in Table 1.
Measurement of saliva. The following saliva measurement was performed once every month at approximately the same clock time to minimize circadian fluctuations. About 100 μl of resting saliva was collected using two neutral paper slips (15 x 10 mm2, YO-11, HORIBA, Jpn) placed between the dorsal tongue and the palates. Approximate time to collect a sample of the resting saliva was also measured by 0.5 min increments. The saliva sample on one paper slip was used for measurements of pH1, ΔpHI and ΔpHL (11), and saliva sample on the other paper slip was used for measurements of Na+ and K+ concentrations.
For recording of the saliva pH curve, a pH meter equipped with a flat-type pH sensor
(Fig. 1A; model C-1, HORIBA, Jpn) and mounted with an adaptor (Fig. 1B, (12)) with a plastic plate was used. After recording a steady pH of the sample at 1 min (Fig. 1C) with the surface of the sample being covered with a plastic plate to block the escape of CO2 from the sample, the initial pH change, ΔpHI (= pH5 - pH1), and late pH change、 ΔpHL (= pH15 - pH5), were measured with the surface of the sample exposed to allow escape of CO2. Concentrations of Na+ and K+ in the sample were measured using ion meters (models C-122 & C-131, respectively, HORIBA). Blood pressure, oral temperature and intermittent serum zinc level were also measured.
Patients in whom a suspected decrease in the activity of the zinc-dependent enzyme carbonic anhydrase due to a low value of ΔpHI had been confirmed by serum zinc analysis were advised to increase mastication efficiency and to increase the consumption of foods containing high zinc contents (7) by about 20%.
Subjective evaluation of severity of symptoms. Each patient was asked to subjectively estimate the severity of their symptoms with scores of zero to five, and to mark on the analog scale of 6.5 cm in condition that grade one is threshold of the symptom, and that grade five is necessary of hospital admission.
Data analysis. A computer (PC-LB500J/22D; NEC, Jpn) and the spreadsheet program (Sanshiro;
Justsystem, Jpn) were used to analyze data within the critical region,
Student's t-test (one sample), and to test presence of correlation. Significance
was judged by the two-tailed test with 5 % error probability.
This study was conducted in accordance with the Helsinki Declaration (13), and informed consent for participation in the study was obtained from all subjects.
Results
About 74% of the subjects had been visited our psychosomatic clinic for 1 to 8 years (mean periods, 2.8 years) before being enrolled in the present study. The following results were obtained after a mean period of 6.6±5.6 months in the low serum Zn group and after a mean period of 7.7±7.2 months in the mid-high serum zinc group.
Changes in serum zinc content, salivary ΔpHI and K+ concentration.
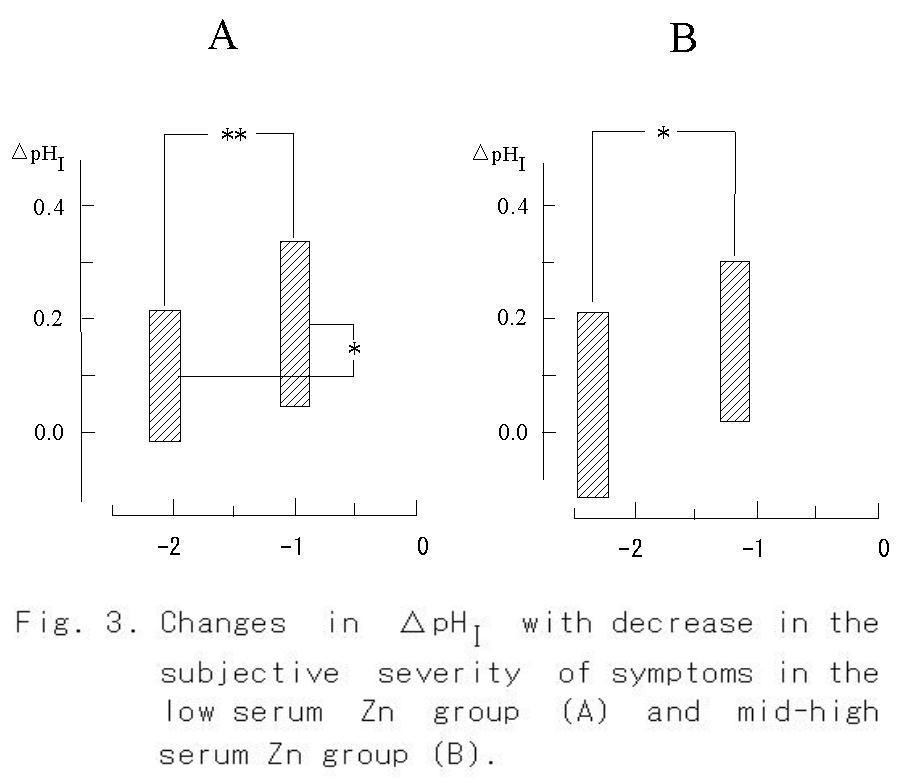
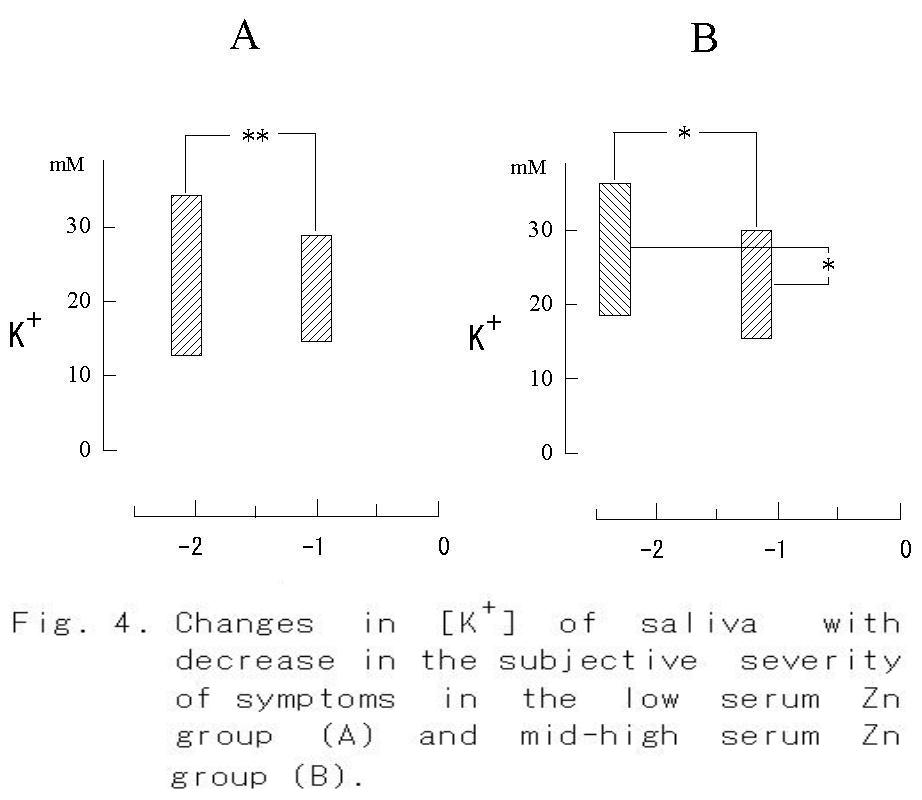
When the subjective severity of each symptom reduced from -2.1 to -1.0 (p < 0.01), a significant increase in serum zinc content was found in the low serum Zn group (Fig. 2A, p < 0.001). On the other hand, no change was observed in the mid-high serum Zn group, though a significant diminution of the symptom was observed (Fig. 2B, p< 0.05). An increase in ΔpHI from 0.10 to 0.19 was observed in the low serum Zn group (Fig. 3A, p < 0.05), whereas no significant increase in ΔpHI was found in the mid-high serum Zn group (Fig. 3B). The concentration of K+ in the saliva did not change with decrease in the severity of symptom, but it decreased significantly in the mid-high serum Zn group (Fig. 4).
Although significant differences were found in serum zinc and in the salivary variables ΔpHI and K+ concentration, there was no significant change in the circulatory indices of blood pressure, pulse pressure, and pulse rate. Decreases in sampling times of saliva from 1.4 to 1.2 minutes in the low serum Zn group and from 2.0 to 1.5 minutes in the mid-high serum Zn group were not significant.
Correlations between systemic condition, serum zinc, and ΔpHI
Since a decrease in the severity of symptoms reflects an improvement in the systemic condition, it was investigated further whether there were any significant correlations between the measured variables. No parameter was found to correlate with improvement in the systemic condition, though positive values were obtained for zinc in the low serum zinc
group and for ΔpHI in the mid-high serum zinc group.
Discussion
Prescription of artificial saliva is one of the choices for treatment of patients with xerostomia due to Sjögren's syndrome or radiation therapy (14). Other approaches are pilocarpine stimulation (15-17), gum chewing (18-19) and acupuncture treatment (20). Our approach is different from these approaches and has not been well accepted yet, though improvement in hyposalivation was observed when zinc treatment was performed for patients with dysgeusia (4). However, we have now the following background in the literature and our results. Other indications of improvement in salivary secretion were an increase in ΔpHI in the low serum Zn group and a decrease in the concentration of K+ in the mid-high serum Zn group, indicating an increase in the flow rate of saliva in the resting state.
Involvement of the activity of carbonic anhydrase (CA) in salivation.
It has been reported that secretion of parotid gland in the red kangaroo was reduced by 87% by application of acetazolamide, a CA antagonist, whereas that of the submandibular gland was unchanged (21). These seem to be conflicting results to explain the involvement of CA in saliva secretion. However, CA density in the dog submandibular gland is only 1/6.5 of that in the parotid gland (22); thus, the effect of acetazolamide in the submandibular gland may be small. Therefore, the suppressive effect of acetazolamide on secretion of the parotid gland is evidence of the involvement of CA in saliva secretion.
Since CA is one of metaloenzymes and it requires zinc to maintain its conformation (23), hyposalivation would occur if the serum zinc level decreased, and hyposalivation should be improved by zinc supplementation.
The results obtained in the low serum zinc group in the present study are therefore reasonable. Statistical significance would support the above discussion. However, no significant correlation was found between any pair of variables, though positive value was calculated between the serum zinc level and the systemic condition in the low serum Zn group. On the other hand, in the mid-high serum zinc group, the coefficient of correlation between systemic condition and ΔpHI was positive. One possible interpretation of these results is that the systemic condition improved with an increase in serum Zn level in the low serum zinc content group, whereas those in the mid-high serum Zn group was improved with increase in ΔpHI and decrease in K+. Further animal experiments are needed to confirm this.
Zinc-dependent enzymes.
Various symptoms such as dermatitis, alopecia, emotional disorder, weight loss, and taste abnormality occur in a state of continuous zinc deficiency (24). Decline in the serum zinc content causes a decrease in the activity of CA as well as 300 kinds of enzymes, including those related to the synthesis of DNA and RNA (25). Such various symptoms would derive form a cause of zinc deficiency. Supporting evidences in some of these symptoms have been obtained in studies in which a zinc-deficient diet was fed to rhesus monkeys (26) and rats (10).
On the other hand, zinc treatment has been reported to improve dysgeusia and dysosmia (3) and also dysgeusia and xerostomia (1, 3). It has also been reported that zinc deficiency has a strong effect on the submandibular gland but not on the other organs (8-9). Considering these reports, it seems reasonable that an improvement in the systemic condition and secretory function of the salivary glands was observed with an increase in the serum zinc content in the present cases. Although systemic symptoms has been explained by zinc deficiency and decay of CA activity in many reports, there is no further explanation of xerostomia in cellular mechanism in the salivary glands. Thus, a model of the secretory mechanism about this part reported in another article (27).
There are two ways to supplement a mild zinc deficiency: one is ingestion of zinc tablets (1-3), and the other is improvement in food selection and in mastication habits, as was used in the present study. Although it is not the time to discuss which one is better, there are two reports on the harmful action of zinc released trans-synaptically when the central nervous system was damaged (28-29). Therefore, we prefer at present to use the latter method with periodical measurements of the serum zinc content to minimize zinc toxication until the daily life rhythm of the patient and the patient's food selection have been stabilized.
Hyposalivation does not directly shorten life span but considerably affects comfortableness in daily life. We hope that the findings presented here will be useful for the treatment of patients with xerostomia.
Acknowledgements
The author thanks Dr. Guo H. Zhang for giving the author an opportunity to present his recent results at the International Conference at NIH, Dr. Kazuharu Mikami for his cooperation in this study, and Mrs. Shizuko Urata for her secretarial help. This study was supported in part by Grants-in-Aid for High Performance Biomedical Materials Research from the Ministry of Education, Culture, Sports, Science and Technology, Japan.
References
1. Tanaka M. Secretory function of the salivary gland in patients with taste disorders. J Otolaryngol Jpn 97:485-493, 1994.
2. Kitagoh H, and Tomita H. Healing process of taste receptor disturbance. J Otolaryngol Jpn 98: 267-280, 1995.
3. Henkin RI, Martin BM, and Agarwal RP. Efficacy of exogenous oral zinc in treatment of patients with carbonic anhydrase VI deficiency. Am J Med Sci 318: 392-404, 1999.
4. Mikami K and Sato TP. Clinical observation of the variation in psychosocial stress and the early change in pH of the resting saliva in a patient of hyperventilation syndrome with dysgeusia. Psychosomat Med Jan 4: 51-55, 2000.
5. Lope P, Castanets M, Lodz G, Munoz E, and Rosado JL. Iron, zinc and copper content of foods commonly consumed in Mexico. Arch Latinoam Nutr 49: 287-294, 1999.
6. Ekmekcioglu C, Anderle H, Strauss-Blasche G, Steffan I, Feyertag J, and Marktl, W. Calcium, magnesium, copper and zinc content of menu components: Comparison of analysed with calculated values. Nahrung 43: 311-316, 1999.
7. http://www2.big.or.jp/~aiken/dic/a/a.html-(zinc)
8. Chaudhry IM, Gandor DW, and Gerson SJ. Reduction of carbonic anhydrase activity in the submandibular salivary glands of zinc-deficient rats. Arch Oral Biol 26: 399-402, 1981
9. Gandor DW, Fanslow DJ, and Meyer J. Effects of zinc deficiency on developmental changes in alkaline phosphatase and carbonic anhydrase activities in the submandibular gland of the rat. Arch Oral Biol 28: 609-615, 1983.
10. Goto T, Komai M., Bryant BP, and Furukawa Y. Reduction in carbonic anhydrase activity in the tongue epithelium and submandibular gland in zinc-deficient rats. Int J Vitam Nutr Res 70: 110-118, 2000
11. Sato TP. A pH curve of human resting saliva sampled with a small paper slip and its medical application. (in contribution)
12. Sato TP. Transient phenomenon pH meter. Utility Model Gazette DB Jpn H02-146361, 1990.
13. Declaration of Helsinki (English version). Brit Med J 2: 177, 1964.
14. Visch LL, 's-Gravenmade EJ, Schaub RMH, Van Putten WLJ, and Vissink A: A double-blind crossover trial of CMC- and mucin-containing saliva substitutes. Int J Oral Maxillofac Surg 15: 395-400, 1986.
15. Guchellar HJ, Vermes A, and Meerwaldt JH: Radiation-induced xerostomia: pathophysiology, clinical course and supportive treatment. Support Care Cancer 5: 281-288, 1997.
16. Davies AN, and Singer J: A comparison of artificial saliva and pilocarpine in radiation-induced xerostomia. J Laryngol Otol 108: 663-665, 1994.
17. Wiseman LR and Faulds D: Oral pilocarpine: a review of its pharmacological properties and clinical potential in xerostomia. Drugs 49: 143-155, 1995.
18. Jensen JL, and Langberg CW: Forbigående stråleindusert hyposalivasjon hos barnepasient. Tidsskr Nor Laegeforen 117: 3077-3079, 1997.
19. Dodds MW, Hsieh SC, and Johnson DA: The effect of increased mastication by daily gum-chewing on salivary gland output and dental plaque acidogenicity. J Dent Res 70: 1474-1478, 1991.
20. Blom M, Dawidson I, Femberg J-O, Johnson G, and Angmar-Mansson B: Acupuncture treatment of patients with radiation-induced xerostomia. Oral Oncol, Eur J Cancer 32B: 182-190, 1996.
21. Beal AM: The effect of carbonic anhydrase inhibitors on secretion by the parotid and mandibular glands of red kangaroos Mcropus rufus. J Comp Physiol - B 161: 611-619, 1991.
22. Maren TH: Carbonic anhydrase: chemistry, physiology, and inhibition. Physiol Rev 47: 595-781. 1972.
23. Taki K: Carbonic anhydrase. J Iwate Med Ass 38: 1-15, 1986.
24. Prasad, AS. Clinical endocrinologic, and biochemical effects of zinc deficiency. Special Topics in Endocrinology & Metabolism. 7: 45-76, 1985.
25. Brandao-Neto J, Madureira G, Mendonca BB, Bloise W, and Castro, AV. Endocrine interaction between zinc and prolactin. An interpretative review. Biol Trace Elm Res 49: 139-149, 1995.
26. Golub MS, Gershwin ME, Hurley LS, Baly DL, and Hendrickx AG. Studies of marginal zinc deprivation in rhesus monkeys. I. Influence on pregnant dams. Am J Clin Nutr. 39: 265-280, 1984.
27. Sato TP. A model of saliva secretion considering the role of carbonic anhydrase. J Jpn Sliv Gl 42: (in press).
28. Suh SW, Chen JW, Motamedi M, Bell B, Listiak K, Pons NF, Danscher G, and Frederickson CF. Evidence that synaptically-released zinc contributes to neuronal injury after traumatic brain injury. Brain Res 852: 268-273, 2000.
29. Suh SW, Jensen KB, Jensen MS, Silva DS, Kesslak PJ, Danscher G, and Frederickson CF. Histochemically-reactive zinc in amyloid plaques, angiopathy, and degenerating neurons of Alzheimer's diseased brains. Brain Res 852: 274-278, 2000.
Chapter 3
Appendix Return to CntentsGoto Index
・Origin of the transient phenomenon pH meter
・Nomogram to estimate [HCO3-] from pH1 and ΔpHI
・Escape of CO2 from a solution
・Influence of humidity on the ΔpHI
・Influence in thickness of sampling sheet on the ΔpHI
・Escape of CO2 with time from a sample of saliva
・Effect of oxygen on the ΔpHL
Origin of the transient phenomenon pH meter:
Jpn. J. Oral Biol., 33: 281-288, 1991.
ORIGINAL
Modification of a simple device for measuring
pH: demonstration of stable pH values and
diurnal variation in human mixed saliva
Tadasi Sato
Department of Oral Physiology, School of Dentistry, Iwate Medical
University, Morioka 020, Japan
(Chairman: Prof. Takashi A. Suzuki)
[Accepted for publication: August 24, 1990]
Index of Jump to the following contents:
pH Variation of the Resting-Saliva during the Recording in the Uncovered Mode
Key words: Mixed saliva/ pH / diurnal rhythm / breathing/ basal pH
Abstract: After investigating the standard error of a plane glass electrode pH meter for a thin layer sample, the pH of human resting saliva collected between the tongue apex and the hard palate with a piece of neutral paper was studied in the following ways.
1. When a subject performed maximum forced nose breathing for 15 see, the pH of the mixed saliva was little changed. In contrast it rose by about 0.2 points after the maximum forced mouth breathing for 15 sec. Thus, the following measurement was performed under conditions avoiding the error caused by mouth breathing and vigorous conversation.
2. The average pH value of the mixed saliva collected in the morning was significantly lower than that of samples (n=5) collected during the daytime.
3. The mean pH value of the mixed saliva from 5 diurnal cycles collected from a single subject indicated a reproducible diurnal change which appeared to consist of 1) a short-lasting variation (about ± 0.5 points) during 0.5-1.5 h after food-intake, and 2) a long-lasting variation (about -1 point) alternating from daytime to night time.
4. A significant finding was an abrupt increase in the pH level observed when changing from the covered mode to the uncovered mode. This increase appeared due to the [HCO3-] change in the saliva and its peak came at approximately 4 min after changing the mode of measurement.
Introduction
lt. has been documented by many investigators that the pH of human mixed saliva changes with variations in 1) the concentration of carbon dioxide in the alveolar air and atrial blood1-3), 2) buffering activity4), 3) quality of the foods5), and 4) secretion speed6-7). In the clinical field, the relationship between the pH of human saliva and tartar formation8) or sugar consumption and dental caries9-10) has been investigated in detail. By using conventional measuring methods, however, it is difficult to design an experiment so that the human subject can avoid discomfort when the samples are collected during the day and night over a period of several days. Thus, such research has not been done extensively. Recently, a card type of pH meter which may overcome such difficulties has become commercially available. Therefore, in this study, the applicability of this new pH meter to the study of human saliva was investigated. A part of the present results have been reported in abstract form11-12).
Materials and Methods
The pH of each sample was measured with a digital pH meter (Horiba C-1; Horiba Ltd., Tokyo) utilizing the newly designed plane glass pH electrode to measure the thin layer sample. With the sensor being located at the bottom of a shallow measuring pool of about 1 mm depth, the test solution was sampled with a piece of neutral sampling paper (sampling Sheet YO11, Horiba Ltd. ; 15 x 10 mm2) which was placed on the pH electrode. The pH meter was calibrated with a set of standard solutions of pH 6.86 and 4.01. The sample of the mixed saliva was collected intraorally by using the sampling paper which had been placed on the dorsal surface of the tongue apex. This paper was made wet with the mixed saliva which was located between the tongue apex and the hard palate. In some experiments, the mixed saliva was expectorated through a polyethylene tube (OD 2 mm; ID 1.5 mm) for 5-10 min and stored in a bottle underneath liquid paraffin at room temperature before being used. The saliva was collected at rest from 5 healthy persons ranging between 15 and 45 years of age, who had brushed their teeth at least once before sleeping.
Stability of pH Measurement
In order to investigate the stability of the pH measurement, the time-dependent change in the displayed value of the pH was recorded 5 times for a standard solution of pH 6.86 and a 0.9% NaCl solution as shown in Fig. 1A. For the standard solution, the difference between the readout value and the final value after 5 min of recording became less than 1% 10 sec after the start of the recording. The mean standard error of the present pH measurement was 0.3% of the final pH value after 5 min of recording Fig. 1A-a). In the case of the 0.9% NaCl solution (not containing buffer) the pH value elevated rapidly 20 sec after the start of the recording and then tended to elevate gradually (Fig. 1A-b). The mean standard error was 4.7% of the final value in this case, while the mean standard error became 1/2.5 of the former error after the surface of the sample was covered with liquid paraffin (Fig. 1A-c). As the magnitude of the standard error and the discrepancy in the mean pH values between curves b and c of Figure lA large during the first 30 sec, a stable pH value with this device could not be obtained during the first 30 sec if the buffering activity of the sample was very weak.
Time-Dependent Change in pH of the Mixed Resting-Saliva
Aliquots of about 60μl of the resting saliva stored in a bottle were used for the pH measurement. The pH of the mixed resting-saliva increased gradually after the start of recording, and the final value was about 0.6 points higher than the initial value (Fig. 1B-a). The mean value of the standard error at each testing point was about 0.8% of the final value, when 5 aliquots from the same sample were tested. This value was clearly smaller than that for the 0.9 % NaCl sample. However, it was hard to record a stable pH value of the saliva by the usual measuring method because of the continuous increase in the displayed value during the 5-min measurement; this was probably due to the volatilization of CO2 from the thin layer sample. Therefore, the surface of the sample was covered
with liquid paraffine (Fig. 1B-b) or a piece of oil paper (Fig. 1 B-c)
and with a standard error of 0.7% a stable pH value was readily obtained.
As the use of oil paper or a plastic plate is convenient for
frequent measurements and the values obtained are comparable to those obtained for liquid paraffin, the following pH measurements in the covered mode were performed by using either oil paper or a plastic plate. The values obtained in the uncovered mode were recorded at about 30 sec after the start of the recording, since the recorded values were approximately the same at this time irrespective of the measuring mode as shown in Fig. 1B.
Results
Effect of Forced Ventilation on the pH Value of the Mixed Saliva
The pH value of the saliva from one subject did not change significantly after maximum nose breathing for 15 sec (Fig. 2A), while it elevated about 0.2 points for 2-3 min after maximum mouth breathing (Fig. 2B). The mean standard errors of pH measured in the covered mode for both breathing procedures (Figs. 2A-b and 2B-b) were 20-50 % smaller than those in the uncovered mode (Figs. 2 A-a and 2B-a).
pH Value of Mixed Resting-Saliva Just Before Rising,
Also Before and After Meals
Without the pH elevation caused by mouth breathing or vigorous conversation, the samples of resting-saliva which were collected from 5 subjects in the morning just before rising from bed (basal pH value) were analyzed for 5 days. The mean pH value fluctuated little in comparison with the range of the standard deviation (Fig. 3A). The standard deviation of the daily data for each person was 27 % smaller than that of all subjects (Table
1).
The pH's of the saliva measured before and after meals were all significantly higher than those of the basal value (p<0.01, Student's t-test), but the deviations were smaller than that
of the basal value (Fig. 3B). In addition, the pH values of the resting-saliva
tended to decrease after meals, though they were not found statistically
significant.
Circadian Rhythm in pH of the Resting-Saliva
In order to investigate whether a circadian change could be detected, the pH value of the resting-saliva of one subject was recorded every l h in the daytime, and every 4-5 h in the night time. It was found that the pH value decreased significantly in the night time (Fig. 4) as compared to the daytime value. Thus, the measurement was continued for 4 more days. The pH value of the resting-saliva increased by about 0.5-1.0 points after rising from bed, stayed at these levels during the daytime, and then went down about 1.0 point in the night time (Fig. 5A). This reproducible rhythmicity was evident in the graph of mean values (Fig. 5B) after minimizing the meal-dependent transient changes of about ± 0.5 points by means of an averaging summation.
pH Variation of the Resting-Saliva during the Recording in the Uncovered Mode
As the pH of the saliva rose with time as shown Fig. 1 B-a, this elevating time course was investigated by increasing the sampling frequency and switching the measuring mode from the covered to the uncovered. A steady pH value of the mixed saliva was recorded from 30
sec to 5 min in the covered mode utilizing a piece of plastic plate, and
then an abrupt increment of pH appeared after switching the measuring method
from the covered to the uncovered mode (Fig. 6A). This increment in pH
was clearly different from the initial instability of the pH meter or the
temperature decrease of the sample due to transfer from the intraoral site
to the surface of the pH electrode. The pH elevation terminated at about
4-5 min alter removing the plastic plate from the surface of the sample.
When this measurement was performed 5 times with 15-min intervals, a marked
deviation was observed as indicated by the vertical bars of Fig. 6A. In
order to examine whether the deviation was mainly due to the error of this
measurement method or to the physiological fluctuation in salivary secretion,
the same measurement was carried out on the saliva discharged through a
poly-ethylene tube and stored in a bottle underneath liquid paraffin at
room temperature (Fig. 6 B). The standard deviation of the latter sample
was about half of those recorded in Fig. 6A. Thus, the standard deviation
in Fig. 6A seems to include both physiological fluctuations in the salivary
secretion as well as errors due to this form of pH measurement.
Discussion
The properties of saliva have been well described from physicochemical and physio1ogicall3-l4), as well as clinical2,15-l6) viewpoints. However, the pH of saliva has not been adopted as a diagnostic index since it is difficult to collect enough volume of the resting saliva because of the low secretion speed at rest. Moreover, the pH value of the saliva tends to be unstable, because the method used for its collection permits the unwanted effects of the volatile CO2 escaping from the saliva. Thus, the possibility of overcoming the difficulty stated above was described in the present paper.
The Horiba C-1 pH meter is designed to measure thin layer samples.
Thus, stable pH values could be readily recorded under an equilibrium state at room temperature and at the Pco2 of the room air. However, it was hard to record stable pH values of the mixed saliva since the displayed value elevated continuously during the 5-min measurement as shown in Fig. 1B-a. Moreover, it was difficult to determine the main cause of the continuous elevation in pH of the saliva among such factors as initial instability of the pH meter, temperature decrease of the sample, volatilization of CO2 gas from the sample, and weakness of the buffer in the sample. After several trials and errors, by switching from the covered to the uncovered measuring mode after termination of change in the displayed value due to the initial instability of the pH meter, it was determined that the pH elevation was probably due to the volatilization of the CO2 in the saliva and not due to the other two factors (see Fig. 6). Therefore, an accurate pH value of the salivary sample can be obtained with this pH meter in the covered mode or just after termination of the initial instability period and/or temperature change in the first 30 sec in the uncovered mode. In addition, collecting a sample just after mouth breathing (Fig. 2 B) or vigorous conversation should be avoided.
Circadian Change in pH of the Mixed Saliva
The pH of saliva is dependent, largely upon secretion speed6-7), and the secretion speed is extremely low in the sleeping periodl9). Thus, the fall of the pH during sleep in Fig. 5A seems to be a result of a decrease in the flow rate of saliva, and the pH elevation after rising from bed is the result of an increase in the flow rate.
Circadian change in the pH of saliva has been reported by Ferguson and his coworkers for stimulated parotid saliva20-21) and resting submandibular saliva22) as a less variable and less reproducible parameter than that of the oral temperature or of the salivary flow rate. Moreover, their results for the pH of resting submandibular saliva have not been well correlated with changes in salivary flow rate associated with alternation in the duration and phase of sleep and being awake23). However the present results seem to agree well with the change in the flow rate and to indicate reproducible cyclic changes as shown in Fig. 5A. In addition, the daily change in the pH of the mixed saliva was confirmed after reducing the transient changes in pH by averaging summation (Fig. 5B). One possible reason for the poor reproducibility for the salivary pH reported previously may be due to the sample volume and collecting time. Ferguson and Fort22) collected samples of 3 ml even during the sleeping period when the flow rate is at its lowest. In the present method, these values were 3 ml vs. 60 μl (50 times smaller) and 30 min vs. 15 sec (120 times faster). Therefore, the present method has the important advantage of being able to record the circadian change in pH of the saliva with respect to the minimum and necessary volume and its collecting time. Recording the circadian change for several days is also possible under the least invasive conditions.
pH of Mixed Saliva and Buffering Activity
In the clinical field of dental medicine, it has been reported that the pH level of the mixed saliva is secondarily correlated with the formation of tartar8) and dental caries9). Moreover, the inspection of salivary pH has been found to have diagnostic value in patients with diabetes mellitus24) and gastric diseasesl4,24-25).
In contrast, the buffering activity of the saliva has been described as having an inverse relation between the pH of the saliva and the CO2 concentration in the alveolar airl) or CO2 binding capacity of the blood2-3). Lilienthal4) has also reported that the buffering activity of the saliva is mainly dependent on the [CO2] and [H3PO4]. Thus, it appears important to study further the pH elevation compared to the baseline in the covered mode in relation to the peak pH value measured in the uncovered mode (Fig. 6), which might be related to the CO2 loss from the sample or an decrease in the [HCO3-1 of the sample. Although further experiments are required to compare this value with the [HCO3-] change in saliva measured by direct measurement, the present method seems to have the advantage that an increase in sampling frequency is possible under clinical conditions and it is possible to trace the physiological change in the [HCO3-] of the saliva in addition to the measurement of the salivary pH.
Acknowledgement
The author expresses great appreciation to the Chairman of The Department of Oral Physiology, Professor Takashi A. Suzuki and Chairman of the Department of Oral Hygiene, Professor Tsuyoshi Katayama, for their valuable criticism and advice; thanks also to Dr. Norio Matsumoto, Dr. Paul Langman, and Ms. Virginia Lee Braymer for their critical reading of the manuscript, Mrs. Shizuko Urata for her secretarial work, and the author's family members for their cooperation in collecting samples of mixed saliva.
抄録:薄層標本測定用の平面ガラス電極型pHメータを使用し、中性紙片で採取した安静時の舌背口蓋問唾液の pHを調べ、以下の成績を得た。
1.口腔を介して15秒間の最大努力呼吸を行った湯合に唾液 pH は呼吸終了後2〜3分間約0.2だけ上昇した。そこで口呼吸や会話による影響を避けながら以下の測定を行った。
2.早朝起床前の混合唾液のpHは日中の食前あるいは食後60分までの間に測定した値より有意に低い値であった。
3.1被験者の5日間の混合唾液pHの平均値は、食後0.5〜1.5時間におけるpH振幅約±0.5の一過性の変動と覚醒時に高く睡眠時に低いpH振幅が約1の長期的な変動との組み合わせであった。
4.本pHメータの測定様式を被覆から非被覆様式に切り替えることにより唾液のpHの他にその緩衝能の指標と成り得る値を数分間で測定出来ることが示唆された。
References
1) Starr, H. E.: Studies of human mixed saliva. II. Variations in the hydrogen ion concentration of human mixed saliva. J. Biol.Chem. 54 : 55-64, 1922.
2) Watanabe, I. : Üer den engen Zusammenhang zwischen der Wasserstoffionenkonzentration des Speichels und der Alkalireserve des Blutes beim Menschen. Tokyo J. Med. Sci. 54 : 886-895, 1940a. (in Japanese).
3) Watanabe, I. : Experimentelle untersuchungen über den engen Zusammenhang zwischen der Wasserstoffionenkonzentaration des Speichels und der Alkalireserve des Blutes beim Kaninchen. Tokyo J. Med. Sci. 54 :896-905, 1940 b. (in Japanese).
4) Lilienthal, B. : An analysis of the buffer systems in saliva. J. Dent. Res. 34 : 516-530,1955.
5) Ericsson, Y. : Clinical investigations of the salivary buffering action. Acta Odontol. Scand. 17 : 131-165, 1959.
6) Iwasaki, H. : Role of carbonic anhydrase in the alkali excretion of salivary gland. II Report. Carbonic anhydrase contents of salivary glands and excretion of alkali in saliva. J. Physio1. Soc. Jpn. 19: 1239-1256, 1957.(in Japanese).
7) Dawes, C. and Jenkins, G. N.: The effects of different stimuli on the composition of saliva in man. J. Physiol. (Lond.) 170 : 86-100, 1964.
8) Naeslund, C. : Studies of tartar formation. Acta Path. Microbiol. Scand. 3 : 637-677, 1926.
9) Fosdick, L. S.: Oral Medicine: Some new concepts concerning the role of sugar in dental caries. Oral Surg. 5 : 615-624,1952.
10) Rugg-Gunn, A. J. : Diet and dental caries. In: Frontiers of Oral Physiology, (ed. by Ferguson, D. B.), Vol. 3, pp. 53-65, Karger, Basel, 1981.
11) Sato, T., Somei, K., Kawarada, K., Ooe, M. and Suzuki, T. A. : An application of digital pH meter of card type for study of change in pH of saliva. Jpn. J. Oral Biol. 30(Suppl.):127, 1988. (in Japanese).
12) Sato, T. : Intraoral positional difference in the time-dependent pH curve and diurnal variation. Jpn. J. Oral Biol. 31(Suppl.) : 90,1989. (in Japanese).
13) Yoshimura, H. : Mechanism of acid-base secretion of digestive glands. J. Physiol. Soc. Jpn. 16 : 105-114, 1954. (in Japanese).
14) Ferguson, D. B. : Physiological, pathological and pharmacologic variations in salivary composition. In : Frontiers of Oral Physiology, (ed. by Ferguson, D. B.), Vo1. 3, pp.138-153, Karger, Basel, 1981.
15) Umeda, E., Kokufu, T. and Nasu, T. : Statistical observation about acidity of gastric juice in patient of diabetic mellitus. Jpn. J. Gastroenterol. 38 : 743-748, 1939. (in Japanese).
16) Reindel, W. : Über die Gesetzmassige Gegensatzlichkeit zwischen den Aciditatsverhältnissen von Mundspeichel und Magensaft. Wien, klin. Wschr. 19 : 390-392, 1940.
17) Krasnow, F. : Biochemical studies of dental caries : diurnal variations in the phosphorus, calcium, hydrogen-ion concentration, and titratable alkalinity. J. Dent. Res. 12 : 530-532,1932.
18) Krasnow, F. : Biochemical analysis of saliva in relation to caries. Dent. Cosmos 78 : 301-310, 1936.
19) Sschneyer, L. H., Pigman, W., Hanahan, L. B. and Gilmore, R. W.: Rate of flow of human parotid, sublingual, and submaxil1ary secretions during sleep. J. Dent. Res. 35 : 109-114, 1956.
20) Ferguson, D. B., E11iott, A. L. and Potts, A.J. : Variations in human parotid saliva over 24-hour periods. J. Dent. Res. 48: 1132, 1969.
21) Ferguson, D. B., Fort, A., Elliott, A. L. and Potts, A. J. : Circadian rhythms in human parotid saliva flow rate and composition. Arch. Oral. Bio1. 18 : 1155-1173, 1973.
22) Ferguson, D. B. and Fort, A.: Circadian variations in human resting submandibular saliva flow rate and composition. Arch. Oral Biol. 19 : 47-55, 1974.
23) Dawes, C.: Circadian rhythms in human salivary flow rate and composition. J. Physiol. (Lond.) 220 : 529-545, 1972.
24) Masuda, S. : Concentration of hydrogen ion of saliva and acidity of the gastric juice. J. Med. Soc. Toho 32 : 634-638, 1943. (in Japanese).
25) Mayama, S., Mizusawa, T. and Tsunokake, S.: A study of the relationship between the acidity of gastric juice and the pH of saliva. J. Iwate Med. Assoc. 4 : 163-165, 1953. (in Japanese).
Nomogram to estimate [HCO3-] from pH1 and ΔpHI
The nomogram was obtained from the data of Fig-2B in chapter 1 and regression line for pH 7.4.
Influence of humidity on the ΔpHI
There was little influence of a change in humidity from 100 % to 50% on the ΔpHI.
Escape of CO2 from a solution
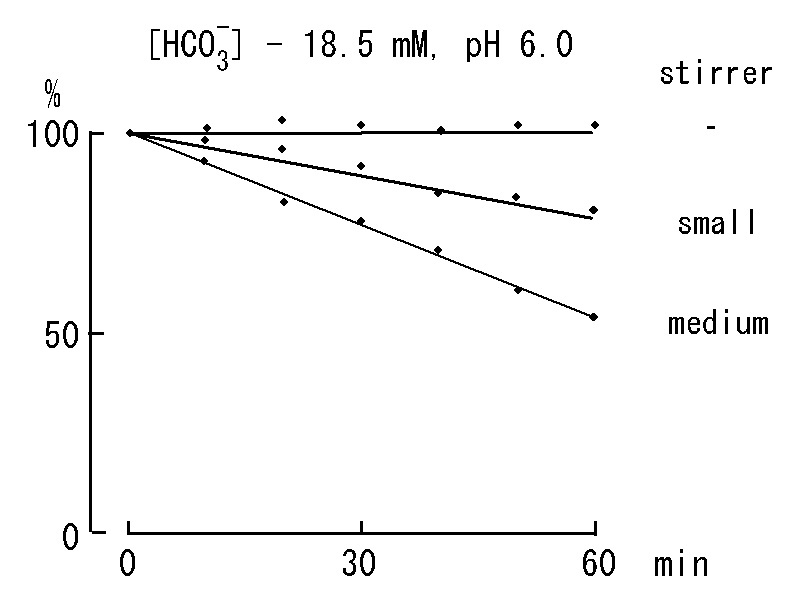
A relative decrease in concentration of HCO3- from initial value of 18.5 mM with time while rotating a stirrer. A volume of solution is 200 ml and initial pH is 6.0.
Influence in thickness of sampling sheet on the ΔpHI
Amplitude of ΔpHI and a crest time of a saliva pH curve increases with increase in thickness of a tissue paper. A TP represents number of tissue paper piled up one over the other. The pH curve for the sample collected with a single sampling sheet (SS) may assume to comparable that of 6 TP.
Escape of CO2 with time from a sample of saliva
Comparing salivary pH curves during repetition of open-close cycles. Dark part of horizontal bars indicate closed period of the surface of saliva sample by a plastic plate. Note upward shifts on the pH curve marked 0.5 minutes of opening period, whereas it was observed only twice at the beginning of the curve marked 1 minute. Concentration of HCO3- at each start of the opening period can be estimated by the nomogram. Results were presented on the following figure.
Concentration of HCO3- decreased quickly when each opening period was 4 minutes, whereas it decreased little in case the opening period awas 0.5 minutes even though a total
of opening period became 4 minutes. This was again confirmed in the following figure.
The pH elevation at second opening period was smaller than that of the first opening period even though adjustment of pH level by addition of HCl. This might due to nonlinear increase of surface plane of the saliva sample by gradual rise up of fibers in the sampling sheet after remove of the plastic plate from surface of the sample. The gradual rise of fibers may be little when the opening period is 0.5 minutes.
Effect of oxygen on the ΔpHL
The ΔpHL of saliva samples is usually negative in polarity. Negative shift on the pH curve seems due to acid production by bacteria in the saliva sample under aerobic condition. This was tested in the following figure in that an amplitude of the negative shift was small under anaerobic condition, indicating a small value of ΔpHL under anaerobic condition.
Index Goto Contents
page
carbonic anhydrase 17
Origin of the transient phenomenon pH meter 52
pH Variation of the Resting-Saliva during the Recording in the Uncovered Mode 58


 The ΔpHI and ΔpHL are index numbers of inverse ratio of hydrogen concentrations between two time points. These pH changes mean accompanying the escape of CO2 during the measurement period, and if the value of them is + 0.3, it means
that the hydrogen ion concentration has decreased by half.
The ΔpHI and ΔpHL are index numbers of inverse ratio of hydrogen concentrations between two time points. These pH changes mean accompanying the escape of CO2 during the measurement period, and if the value of them is + 0.3, it means
that the hydrogen ion concentration has decreased by half.